3.1 Study Design
In this study, cross-sectional descriptive study was use by the researcher. Cross sectional because the study was conducted in one place, which is Ademasajida, at one time. The study was descriptive because it seeks to describe the knowledge of the community members (population of reproductive age) towards prevention of STI as it exists at the time of study. It was also aimed at gathering data without any manipulation of the research context. Its non-intrusive and was with naturally occurring phenomena; the community attitude towards prevention of STIs.
3.2 Study Area
The study was carried out in Ademasajida town, Ademasajida location. This is a residential and a commercial area where local residents reside. According to the National census 2009, Ademasajida had a population 23432 of which majority are youth.
3.3 Study Population
The study population included men and women of reproductive age who are residents of Ademasajida town.
3.4 Inclusion and Exclusion Criteria
3.4.1 Inclusion Criteria
The study included men and women of reproductive age (15-49) who are residents of Ademasajida Town who consented to participate in the study. According to the last 2009 Census the number of people at the ages of 15-49 stands at 7921.
3.4.2 Exclusion Criteria
Those excluded from the study was men and women who are above reproductive age and who are not residents of Ademasajida Town or those not willing to participate in the study.
3.5. Sample Size and Sampling Technique
3.5.1 Sample Size
The sample size will be calculated using the standard sample size calculation formula by Mugenda and Mugenda, (2003).
nf= N1+Nn
Where: N =
z2 pqd2
nf = desired sample size where population is less than 10,000
P = The proportion of the target population estimated to have a particular characteristics being measured in this case proportion of men and women with STIs taken as 40% (0.4)
z = Standard normal deviation which is 1.96 at 95 % level of confidence.
q = 1 – p = 1-0.4 = 0.6
d = Degree of accuracy desired is 0.08
N =
1.962×0.4× 0.60.082 =
150
Therefore nf =
1501+1507921 = 147.20 = 147 respondents
3.5.2 Sampling Technique
The sampling technique used was simple random sampling. This was to ensure there was no bias as it’s based on statistical methods and can be subjected to statistical analysis thus giving reliable results.
3.6 Study variables
The dependent variable was the measures taken by men and women of reproductive age (15-49 years) in prevention of STIs
The independent variables include: Age, level of education, beliefs and occupation.
3.7 Data collection procedures
3.7.1 Instruments
A questionnaire was be used to collect data. The questionnaire entails close ended questions. The questions are based on the specific objectives to ensure that the researcher meets the broad objective of the study.
3.7.2 Pre-Testing
The questionnaire was pre-tested in Ndege- Wajir South where 15 community members (10% of the sample) was given the questionnaire to fill. This is because Ndege has a similar population as Ademasajida Town. Adjustments will be done to ensure validity and reliability of the questionnaire.
3.7.3 Data Collection Process
This employed both self-administered and researcher administered methods. In self-administered the community members was given the questionnaire to fill and then return upon completion. The researcher administering questionnaires was appropriate to ensure that community members of the different levels of education were catered for including those who can’t read for themselves. The researcher took the initiative of ensuring that translation was done for the respondents who can’t read for themselves.
3.8 Data Management and Analysis
Presentation of quantitative information was done using statistical packages (tables and pie charts). Data categorization and coding was be carried out during preparation of questionnaires. Each data collected was entered, coded and keyed into variables using Microsoft office Excel. Quantitative and qualitative data was analyzed using Microsoft Office Excel.
3.9 Study Limitations
Financial constraints which led to selection of a small sample size which may not be a true representation of the whole population. This was countered by using a good sampling technique that ensured equal chances of respondent selection.
3.10 Ethical Considerations
- A letter of introduction from Kenyatta University was obtained by the researcher from the Environmental Health department.
- Permission from the Ademasajida sub-location chief who was informed about the study.
- Informed consent was obtained from Ademasajida community members fitting in the research study.
- Confidentiality and respect was maintained throughout the research process.
- Feedback was given after the study was over to the relevant administration.
CHAPTER 4: DATA ANALYSIS AND PRESENTATION
The purpose of this study was assessment of knowledge status on Prevention of sexually transmitted infections among population in Reproductive age in Ademasajida town Wajir West Sub County. The respondents were aged between 15-49 years.
4.1 Introduction
The researcher administered 147 questionnaires to Ademasajida town residents and 136 respondents returned the questionnaires after filling. This represented 92% response rate to the study.
This chapter represents the study findings. The data was analyzed using Microsoft Office excel and the data findings were presented in form of tables, pie charts, bar graphs, line and circle graphs. Percentage calculations on the responses were also done to clearly bring out comparisons on answers to the questions that were being asked during the study.
Respondents comprised of 81 male respondents and 55 female respondents. Eleven respondents did not return the question papers used for data collection process.
The Table below shows respondents met during the study.
Table 4.1 Respondents Sex
| SEX |
RESPONDENTS |
PERCENTAGE |
| MALE |
81 |
55% |
| FEMALE |
55 |
37% |
| TOTAL |
136 |
92% |
Source: field data( December 2016)
It was observed the male respondents met are larger in number than their female counterparts, which may indicate the number of male population is higher than female in Ademasajida town . It can be also deduced that the workforce of Ademasajida Town are male dominated.
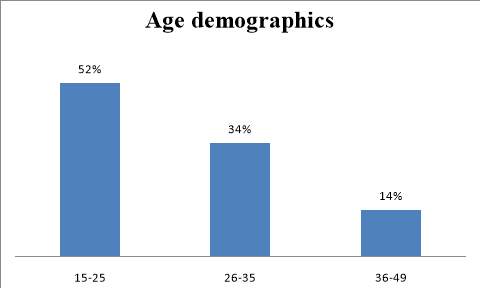
4.1.1 Age Demographics
The majority Fifty two percent (n=71) of the respondents met were between ages of 15-25 years. 34% (n=46) of respondents were between ages 26-35 and ages 36-49 had 14%. (n=19) of total respondents.
. 
Source: field data( December 2016)
Figure 4.1.1 Age of the respondents
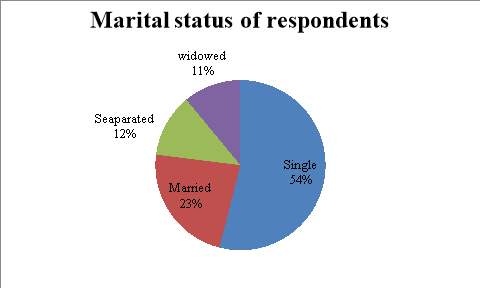
4.1.2 Marital Status
On marital status, majority 54% (n=73) of the respondents were single. Those married were 23% (n=31) while 12% (n=17) were separated and 11% (n=15) were widowed. Most of the residents of Ademasajida are youths who cited lack of job as a big role in this people’s inability to marry. Some are still students who are committed in studies and have no time to marry.
Source: field data( December 2016)
Figure 4.1.2 Marital status of respondents
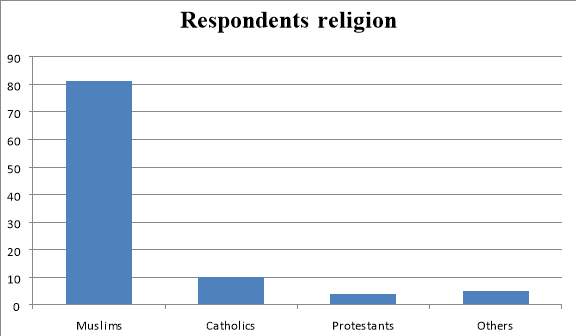
4.1.3 Religion
On religion, majority of Ademasajida Town profess Muslim faith. The areas situated in North Eastern region of Kenya is usually dominated by the Muslims.
Of the total respondents, 81% (n=110) indicated that they were Muslims .Catholics account for 10% (n=14,) Protestants were 4% (n=5) while 5% (n=7) said they were neither of the above faiths.
Source: field data( December 2016)
Figure 4.1.3 the religious status of respondents.
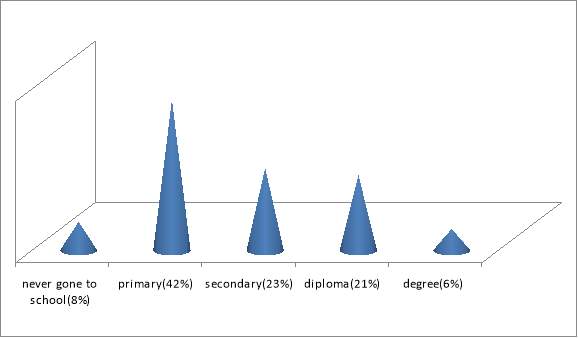
4.1.4 Level of Education
Literacy level is high among the respondents and stands at 92% (n=125) . This area is quite accessible to the education facilities since independence. There are many schools(primary and secondary schools) either public or private situated close or in the area. Those with post-secondary school qualification( diploma and degree) studied from distant places like Nairobi and other towns with higher institutions like colleges and universities. Most of those with post-secondary school qualification are working in the county government as accountants ,health workers,etc . Those who said they have never gone to school were older people involved in shop keeping and casual works mostly aged above 35 years.
23 percent (n=31) of the respondents indicated that they had graduated from secondary school while 21% percent (n=29) are either pursuing or graduated with Diploma and those with Degree are 6 %( n=8). Only 8% (n=11) of the respondents said they did not go to school and 42 %( n=57) reached primary level.
Source: field data( December 2016)
Figure 4.1.4 level of education of the Respondents
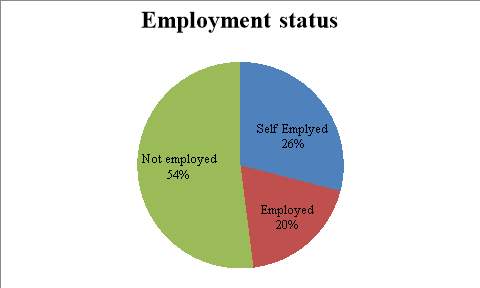
4.1.5 Occupation
Majority of the respondents said they are not employed 54% (n=73) and the self employed are 26% (n=36) and those employed by other people are 20 %( n=27)
Source: field data( December 2016)
Figure 4.1.5 Occupation of the Respondents
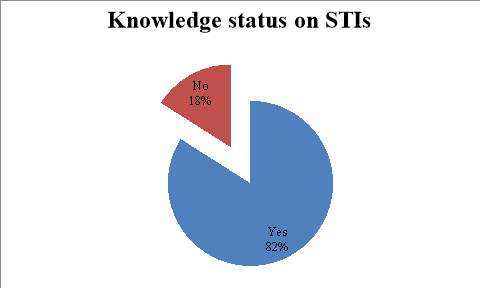
4.2.0 HEALTH KNOWLEDGE ON STIs.
To find out health knowledge on STI, the study used various questions directed to gather information whether the community have an understanding of STI and its health risks. Those who responded positively to the question whether they have heard or aware of the Sexually Transmitted infection conditions are 82% (n=112) those who said they are not aware of STIs are 16 % (n= 24)
Source: field data( December 2016)
Figure 4.2 Awarenesson STI
4.2.1 Response of transmission routes of STIs
All respondent knew the way in which STIs is transmitted from one person to another. This is again influenced by the level of education of the youth. The main route of STIs transmission cited by the youth was unprotected sexual intercourse with an infected person (65%). This knowledge makes the youth to avoid unprotected sexual intercourse hence contributing to the prevention of STIs. This was followed by having many sexual partners (21%). The youth were aware that engaging sexual relation with many sexual partners is a risky behavior of contracting STIs hence they tend to avoid it and instead have one sexual partner. Having many sexual partners is a risk behavior for contracting STDs easily (Kann and Kinchen, 1999). The youth had little knowledge on other ways in which STIs is transmitted. This included blood transfusion (15%), infected needles (13%) and mother to child transmission (8%).
Table 4.2.1 Response on Transmission routes
| ROUTES |
|
Number of times each box was ticked |
|
PERCENTAGE |
| Blood transfusion |
|
21 |
|
15% |
| Infected needles |
|
17 |
|
13% |
| Unprotected sexual intercourse |
|
89 |
|
65% |
| Mother to-baby transmission |
|
11 |
|
8% |
| Many sexual partners |
|
28 |
|
21% |
|
|
|
| Total |
|
166 |
|
122% |
|
|
|
|
|
|
|
|
|
Source: field data( December 2016)
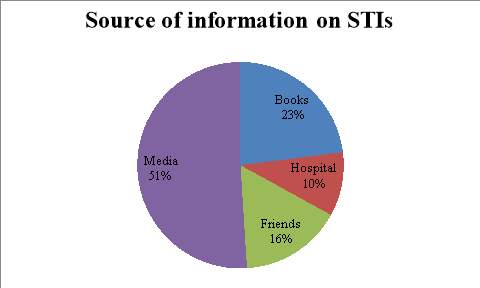
4.2.2 Source of information on STIs
The percentage of respondents who said they got the information on STIs from Books are 23 %( n=31) while those who get their information form hospital staff and brochures are 10 %( n=14). 16% said the vital information is shared with them by friends which are 22 respondents. Media account for the largest sources of information 51% which stand for 69 respondents.
Source: field data( December 2016)
Figure 4.2.2 Source of information on STIs
4.2.3 The various sexually transmitted infections known by the respon dents.
Table 4.2.3 STIs known to the respondents
| DISEASE |
Frequency out of 136 |
