Chapter 1:- INTRODUCTION
Now-a-days, the use of mobile applications and websites have become very popular. Web applications and mobile applications are in great use and represents the best example for managing online information in its best way. It offers faster process to broadcast data and reduces the cost. By using the mobile application, there is flexibility in managing the data.
1.1 PROJECT SUMMARY
Crops Bazar is a web application as well as an android application that helps the farmer and businessman to interact with each other without any mediator. This system will help the farmer to get the actual price for his inputs (crops). With the help of this system, the farmer will be able to know the best value for his product (crops) and will not be fooled by the marketers. In fraudster’s cases the user will be able to block the fraud user.
1.2 PURPOSE
The main objective of this system is to help the farmer’s, businessman’s and the customer’s to get the best price from his inputs. In this system the farmer will upload crops and the businessman will then bid for the crop and then among the best five bidders one will be chosen. This system is also having a special feature of blocking the fraud user’s.
In the existing system, the farmers were unable to get best price as were also fooled by the mediators or retailer. In this system the farmer will get to know the actual price of the particular product and thus there will be no possibilities of getting fooled.
The major benefit of this system will be that, it is time saving and feasible. The farmer’s does not need to travel long distance to sell their products (crops). Everything can be easily done using a smart phone and an internet connection.
1.3 SCOPE
This system is going to be developed in order to have better communication between the farmer’s and the businessman’s. The user will be able to login into the system and perform the appropriate tasks that are the farmer will be able to upload the crops with the minimum price and on that basis the businessman will be able to perform the auction.
The admin will be able to keep the track of all the activities of farmer’s and businessman’s and also keep the track of reports.
In the existing system there was no facility of online payment as well as the admin was not able to track the actual amount of the product but in our system these features are adopted.
1.4 REPORT OUTLINE
Chapter 1: In this chapter we have given the overview of the project, purpose of the project and scope of the project.
Chapter 2: This chapter describes the detailed study of the proposed system and the technologies used in it.
Chapter 3: This chapter gives information about project planning and scheduling. It describes the approaches for project development.
Chapter 4: It gives information about the software and hardware requirements of the project. It also include the functional ad non-functional requirements.
Chapter 5: This chapter gives the information about the analysis of the system. It describes the study of feasibility-technical feasibility, economical feasibility and operational feasibility. It also describes the major functions of the project and contains the diagrams like ER diagram, class diagram, sequence diagram, activity diagram and data flow diagram to study the behavioral and functional aspects of the system.
Chapter 6: This chapter includes the schema designing and database that is used to store the data.
Chapter 7: This part includes the implementation of the project.
Chapter 8: This chapter contains conclusion of the project and the remaining project work of the project.
Chapter 2:- LITERATURE REVIEW
In the existing system, the agricultural marketing still continues to be in a bad shape in rural India. In the absence of modern marketing facilities, the farmers have to depend upon local traders and middlemen for the disposal of their farm produce which is sold at throw-away price. Additionally, the farmers have to travel long distance to sell their product (crops). In most cases, these farmers are forced, under socio-economic conditions, to carry on distress sale of their produce. In most of small villages, the farmers sell their produce to the money lender from whom they usually borrow money.
According to an estimate 85 per cent of wheat and 75 per cent of oil seeds in Uttar Pradesh, 90 per cent of Jute in West Bengal, 70 per cent of oilseeds and 35 per cent of cotton in Punjab is sold by farmers in the village itself. Such a situation arises due to the inability of the poor farmers to wait for long after harvesting their crops.
In order to meet his commitments and pay his debt, the poor farmer is forced to sell the produce at whatever price is offered to him. The Rural Credit Survey Report rightly remarked that the producers in general sell their produce at an unfavourable place and at an unfavourable time and usually they get unfavourable terms.
In the absence of an organised marketing structure, private traders and middlemen dominate the marketing and trading of agricultural produce. The remuneration of the services provided by the middlemen increases the load on the consumer, although the producer does not derive similar benefit.
In order to save the farmers from such problems, we have taken an initiative to develop an online electronic markets. This system will help the users to a great extend to overcome their problems.
This system will help the farmers to know the actual price of the product in the markets so that the farmers can sell their product at the real price and gain profit. Moreover, in this system there is no middleman so the farmer’s does not need to sell their product at unprofitable price. Also the farmer’s does not need to travel long distances to sell their products. Moreover in fraud cases the user can block the user and can report a complain for the fraud user. There is no bargaining in this system so there is no matter of arguments in this system, each and every task is performed peacefully without any fights and arguments.
The businessman performs auction in order to buy the crop. Among the top five bidders the farmer can choose the best one to whom he want to sell the crop. This auction will be for a fixed time limit. Within the given time limit the businessman will get chance to bid for the crops. Thus this system is feasible and provides an innovativeness compared to the existing system.
Chapter 3:- PROJECT MANAGEMENT
3.1 PROJECT PLANNING AND SCHEDULING
3.1.1 Project Development Approach
Our project is developed using specific software development lifecycle. A software development process or life cycle is a structure imposed on the development of a software product. There are several processes, each describing approaches to a variety of task or activities that take place during the process. A process model is a development strategy that is used to achieve a goal that satisfies the requirements abiding by the constraints.
Iterative Water Fall Model
The waterfall model is the first process model to be introduced. It is also referred to as a linear sequential life cycle model. It is very simple to understand and use. In a waterfall model, each phase must be completed fully before the next phase can begin. This type of model is basically used for the project which is small and there are no uncertain requirements. At the end of each phase, a review takes place to determine if the project is on the right path and whether or not to continue or discard the project. In this model the testing starts only after the development is complete. In waterfall model phases do not overlap.
The software development starts with requirements gathering phase. Then progresses through analysis, design, coding, testing and maintenance. Following figure illustrates waterfall model.
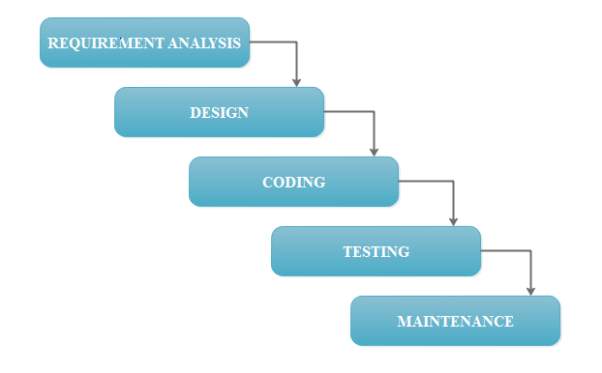
Figure 3.1: Iterative Waterfall Model
System Engineering:
Analysis: The aim of the requirement analysis is to understand the exact requirements of the students and to document them properly.
1. Requirement gathering and analysis:In this phase, the basic requirements of the system is understood. The information domain, function, behavioural requirements of the system are understood. All these requirements are then well documented ad discussed further with the customer, for reviewing.
2. Requirement Specification: The student requirement identified during requirement gathering and analysis activity are organized into a software requirements specification(SRS).
Design:The design is an intermediate step between requirements analysis and coding. Design focuses on the program attributes such as- Data structure, Software architecture, Interface representation, Algorithmic details.
The requirements are translated in some easy to represent form using which coding can be done effectively and efficiently. The design needs to be documented for further use.
Coding:Coding is a step in which design is translated into machine-readable form. If design is done in sufficient detail then coding can be done effectively. Programs are created in this phase.
Testing:Testing begins when coding is done. While performing testing the major focus is on logical internals of the software. The testing ensures execution of all the paths, functions behaviours. The purpose of testing is to uncover errors, fix the bugs and meet the customer requirements.
Maintenance:Maintenance is the longest life cycle phase. When system is installed and put in practical use the error may get introduced, correcting such errors and putting it in use is the major purpose of maintenance activity. Similarly, enhancing system’s services as new requirements are discovered is again maintenance of the system.
Advantages of iterative waterfall model:
In iterative model we can only create a high-level design of the application before we actually begin to build the product and define the design solution for the entire product. Later on we can design and built a skeleton version of that, and then evolved the design based on what had been built.
In iterative model we are building and improving the product step by step. Hence we can track the defects at early stages. This avoids the downward flow of the defects.
In iterative model we can get the reliable user feedback. When presenting sketches and blueprints of the product to users for their feedback, we are effectively asking them to imagine how the product will work.
In iterative model less time is spent on documenting and more time is given for designing.
3.1.2 Project Plan
In this part, we have done the planning of our project. We have four modules in our project:
Verification module:In this module, verification of the user is done that is the user is verified whether he/she is a farmer or businessmen. This is done on the basis of the license of the particular user. This verification is done during the registration process. So after the completion of verification login can be done.
Crop Management module:In this module, the crop updation management is done. Crop are properly managed for further auction process.
Bidding module:This module manages the auction process. Here the bidding details are managed and the winner detailes are viewed.
Online Payment module:After the generation of the winner details, this module is carried out. In this module, the online payment process is done.
3.1.3 Schedule Representation
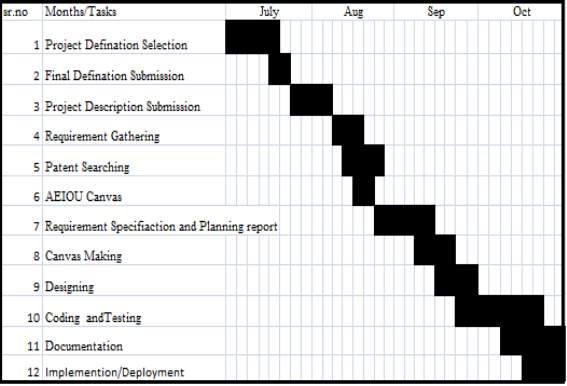
Figure 3.2: Gantt Chart
Chapter 4:- SYSTEM REQUIREMENT SPECIFICATION
4.1 USER CHARACTERISTICS
4.1.1 Admin
Login to access the website and allow user to login in.
Allows the user to register in the system.
Will verify the type of user.
Keep track of auction.
Block the fraud user if any.
4.1.2 Farmer
Register for a new account.
Login to the account.
Upload crops.
View auction.
Choose among the best bidder.
Report a complain, if any
4.1.3 Businessman
Register for new account.
Login to the account.
View the uploaded crops.
Perform auction.
View bidding details and winner details.
Report a complain, if any.
4.2 HARDWARE & SOFTWARE REQUIREMENTS
Software Requirement:
Front end: PHP and Android Studio 1.2.2 and above.
Back end: MySQL Server
Operating system: Microsoft Windows XP and greater, Android jellybean(4.0) and greater.
Hardware Requirement:
RAM: 1GB and above.
Hard Disk: Minimum 4GB and above.
Processor: Intel core i3 and above
Chapter 5:- SYSTEM ANALYSIS
5.1 FEASIBILITY STUDY
Feasibilty study is used to determine the viability of an idea. The objective of such a study is to ensure a project is legally and technically feasible and economically justifiable. It tells whether the project is worth the investment. The proposed study is to determine whether the proposed system is feasible. The feasibility study involves following main criteria:
- Whether the user’s are satisfied using the currently running system.
- The study will decide if the new system to be developed will benefit the user’s or not.
- The study should be cheap and quick.
- The result should inform the decision of whether to go ahead with a more detailed analysis.
The three tests of feasibility have to be carried out:
- Technical Feasibility
- Economical Feasibility
- Operational Feasibility
5.1.1 Technical Feasibility
In technical feasibility study, one have to test whether the proposed system can be developed using the existing technology or not. It is planned to implement the proposed system Php and android studio. It is evident that the necessary software and hardware are available for the development and implementation of the proposed system. Hence, the solution is technically feasible.
5.1.2 Economical Feasibility
As a part of this, the costs and benefits associated with the proposed system compared and the project is economically feasible only tangible and intangible benefits outweigh costs. The system development costs will be significant. So the proposed system is economically feasible.
5.1.3 Operationl Feasibility
It is a standard the ensures interoperability without stifling competition and innovation among user’s to the benefit of the public both in terms of cost and service quality. The proposed system is acceptable to user’s. so the proposed system is operationally feasible.
5.2 FUNCTIONS OF SYSTEM
5.2.1 Use Case Diagram
Use case diagram models the functionality of a system using actors and use cases.
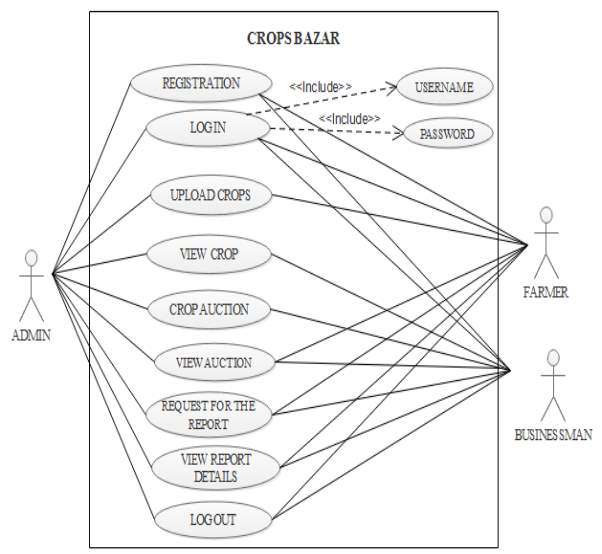
Figure 5.1: Use Case Diagram for Crops Bazar
5.3 DATA MODELLING
5.3.1 Class Diagram
Class diagrams are used to capture the static view of the system. Basically class diagram represents how to put various objects together. The class diagram gives an overview of a system, in which various classes and relationship among these class is represented.
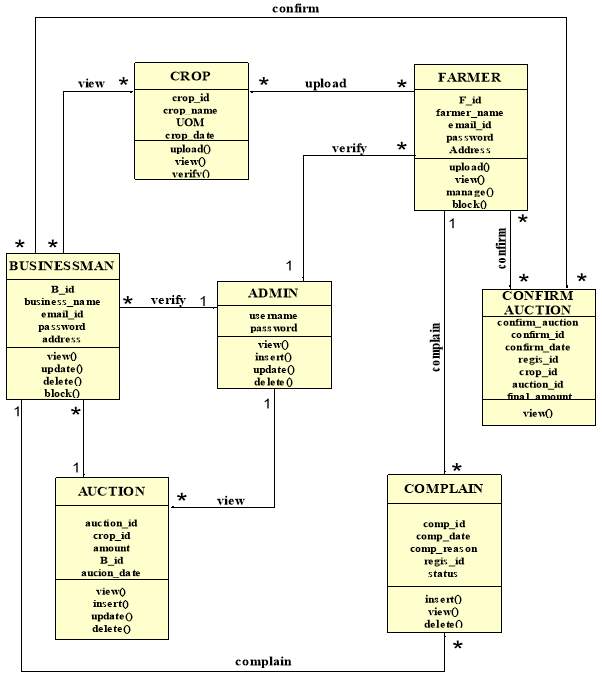
Figure 5.2: Class Diagram for Crops Bazar
5.3.2 E-R Diagram
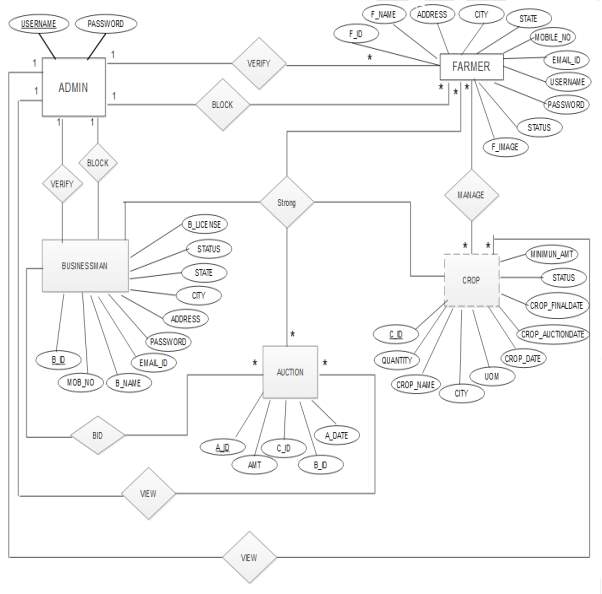
Figure 5.3: E-R Diagram for Crops Bazar
5.3.3 Activity Diagram
The activity diagram is a graphical representation for representing the flow of interaction within specific scenerios. It is similar to a flow chart in which various activities that can be performed in the system are represented. This diagram must be read from top to bottom. It shows the sequence of activity and state.
Activity: Represents the performance of task or duty in the work flow.
 Start state: Shows the beginning of the workflow.
 End state: Finds the final or terminal state.

5.3.3.1 Activity diagram for Verification
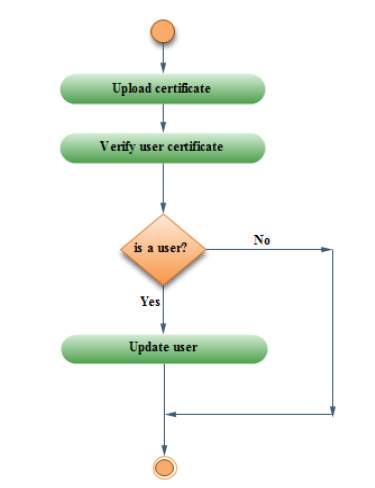
Figure 5.4: Activity diagram for Verification
5.3.3.2 Activity diagram for Crop Management
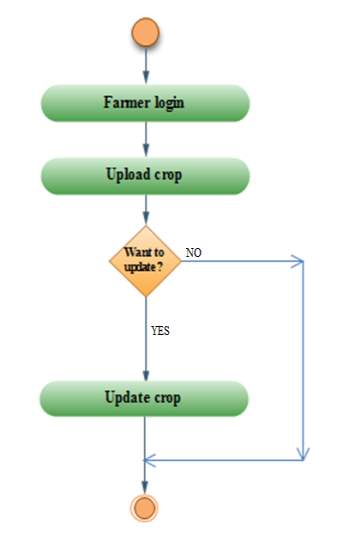
Figure 5.5: Activity diagram for Crop Management
5.3.3.3 Activity diagram for Bidding
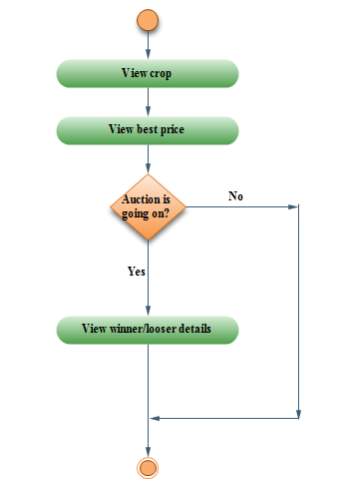

Figure 5. 6: Activity diagram for Bidding
5.3.3.4 Activity diagram for report
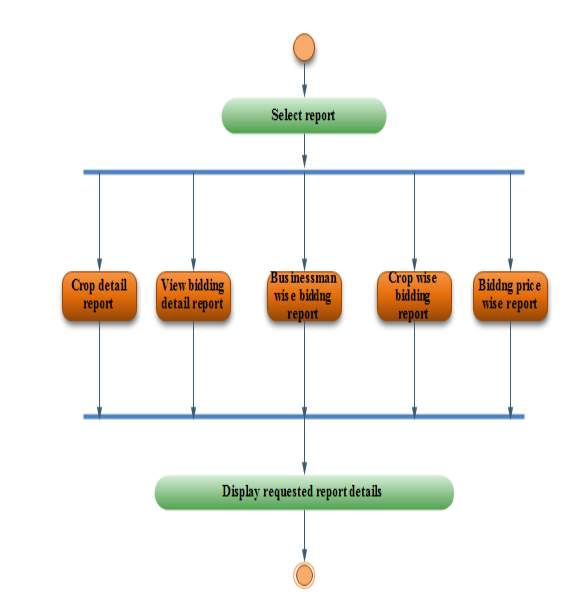
Figure 5.7: Activity diagram for Report
5.3.4 Sequence Diagram
5.3.4.1 Sequence diagram for Farmer
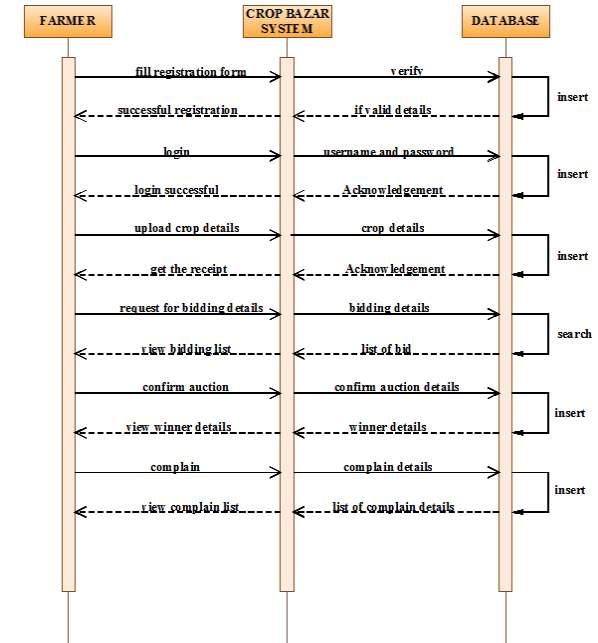
Figure 5.8: Sequence diagram for Farmer
5.3.4.2 Sequence diagram for Businessman
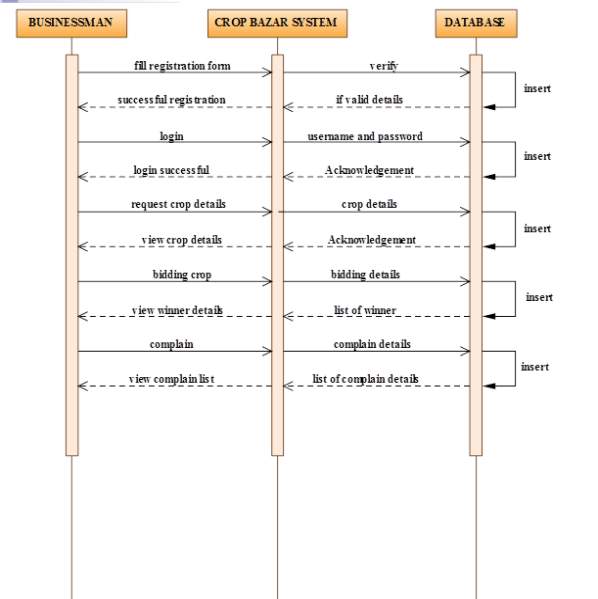
Figure 5.9: Sequence diagram for Businessman
5.3.4.3 Sequence diagram for admin
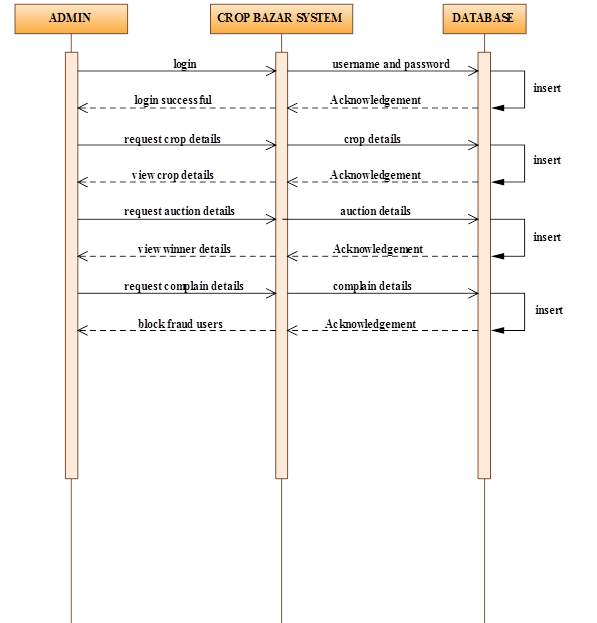
Figure 5.10: Sequence diagram for Admin
5.4 FUNCTIONAL AND BEHAVIOURAL MODELLING
5.4.1 Data Flow Diagram
DFD LEVEL-0:
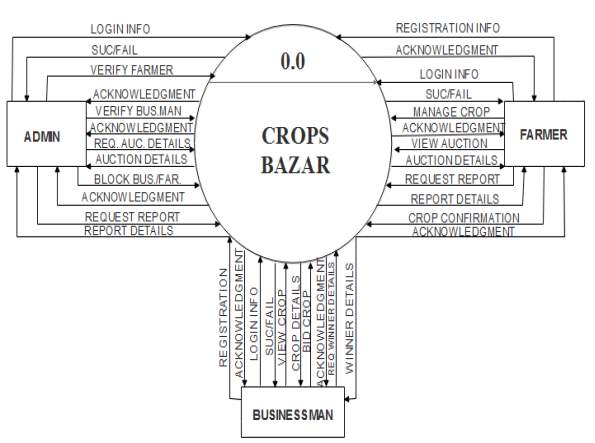
Figure 5.11: DFD Level-0 for Crops Bazar
DFD LEVEL-1:
Registration:
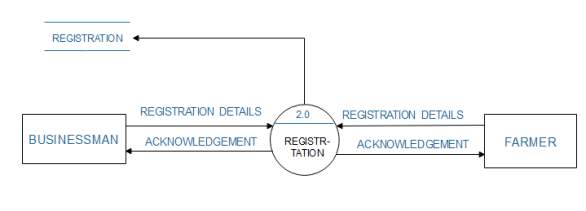
Figure 5.12: DFD Level-1 for Registration
Login:
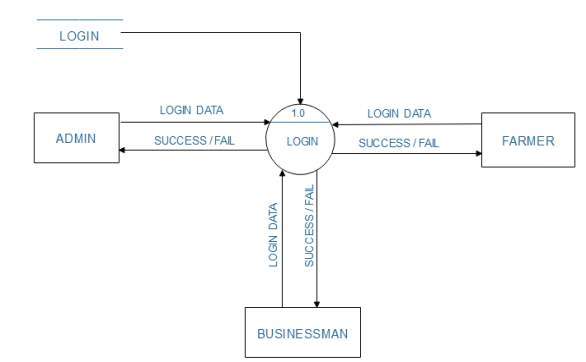
Figure 5.13: DFD Level-1 for Login
Crops:
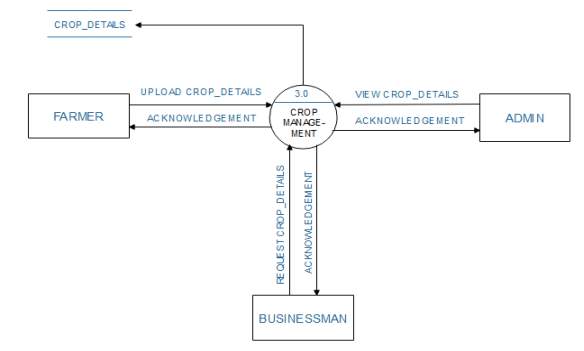
Figure 5.14: DFD Level-1 for Crops
Auction:
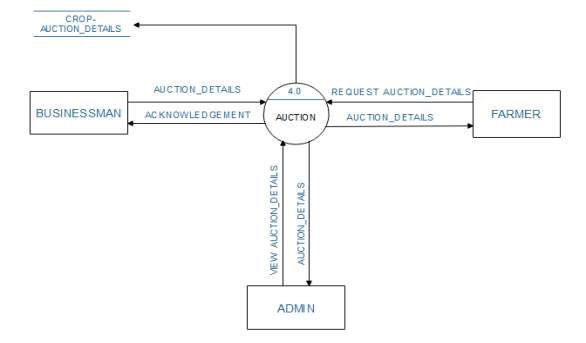
Figure 5.15: DFD Level-1 for Auction
Complain:
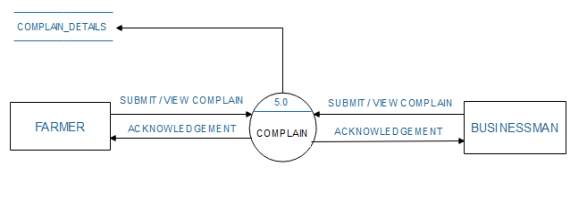
Figure 5.16: DFD Level-1 for Complain
Report:
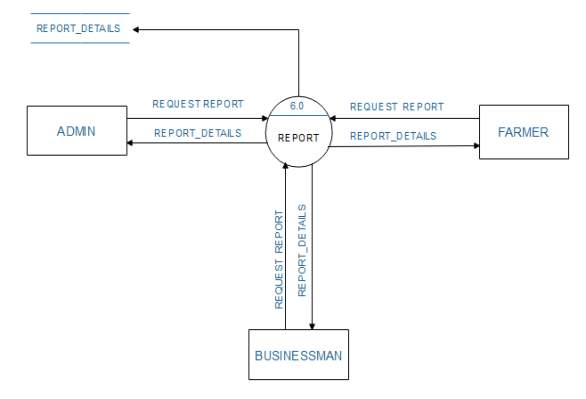
Figure 5.17: DFD Level-1 for Report
DFD LEVEL-2:
Registration:
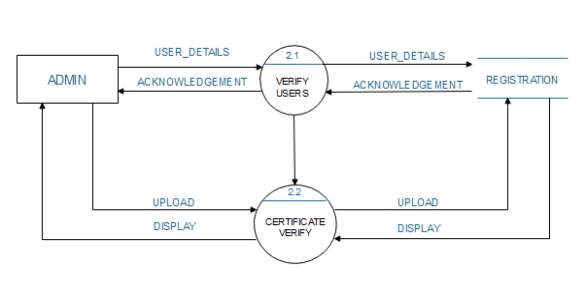
Figure 5.18: DFD Level-2 for Registration
Crops:
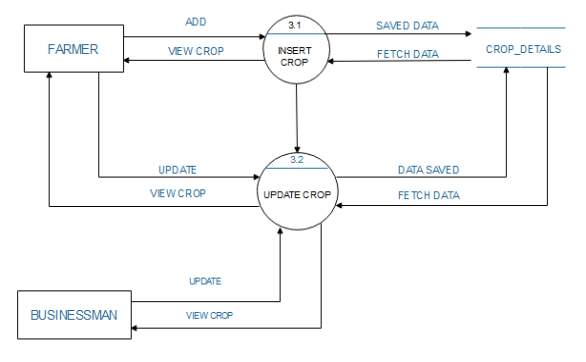
Figure 5.19: DFD Level-2 for Crops
Auction:
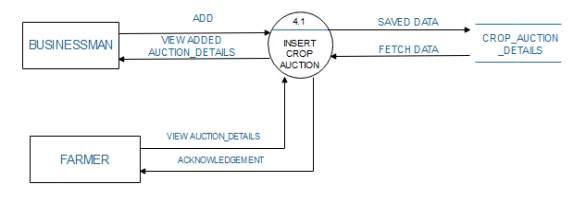
Figure 5.20: DFD Level-2 for Auction
Complain:
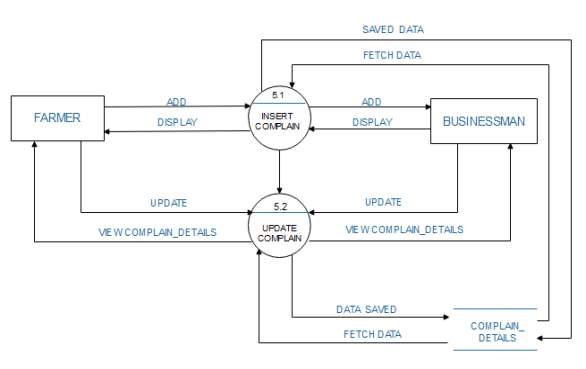
Figure 5.21: DFD Level-2 for Complain
5.5 DATABASE SCHEMA DESIGN
5.5.1 Database for Registration:
Table 5.1: Registration table
| FIELD_NAME |
DATA_TYPE |
SIZE |
DESCRIPTION |
| REGIS_ID |
INT |
[10] |
NOT NULL(PRIMARY KEY) |
| REGIS_NAME |
VARCHAR |
[50] |
NOT NULL |
| ADDRESS |
VARCHAR |
[255] |
NOT NULL |
| CITY |
VARCHAR |
[50] |
NOT NULL |
| STATE |
VARCHAR |
[50] |
NOT NULL |
| MOBILE_NO |
VARCHAR |
[10] |
NOT NULL |
| A_MOBILE_NO |
VARCHAR |
[10] |
NOT NULL |
| EMAIL_ID |
VARCHAR |
[50] |
NOT NULL |
| PWD |
VARCHAR |
[10] |
NOT NULL |
| STATUS |
INT |
[1] |
NOT NULL |
| PROOF_IMG |
VARCHAR |
[50] |
NOT NULL |
| USER_TYPE |
VARCHAR |
[20] |
NOT NULL |
5.5.2 Database for Admin:
Table 5.2: Admin table
| FIELD_NAME |
DATA_TYPE |
SIZE |
DESCRIPTION |
| USERNAME |
VARCHAR |
[50] |
NOT NULL(PRIMARY KEY) |
| PWD |
VARCHAR |
[10] |
NOT NULL |
5.5.3 Database for crop_detail:
Table 5.3: Crop_detail table
| FIELD_NAME |
DATA_TYPE |
SIZE |
DESCRIPTION |
| CROP_ID |
CROP_NAME |
[10] |
NOT NULL(PRIMARY KEY) |
| CROP_NAME |
VARCHAR |
[50] |
NOT NULL |
| CITY |
VARCHAR |
[50] |
NOT NULL |
| UOM |
VARCHAR |
[10] |
NOT NULL |
| CROP_DATE |
DATE |
|
NOT NULL |
| CROP_START_DATE |
DATE |
|
NOT NULL |
| LAST_DATE |
DATE |
|
NOT NULL |
| QTY |
FLOAT |
|
NOT NULL |
| MINIMUM_AMT |
INT |
[10] |
NOT NULL |
| REGIS_ID |
INT |
[10] |
NOT NULL |
| STATUS |
INT |
[1] |
NOT NULL |
5.5.4 Database for Crop_auction_detail:
Table 5.4: Crop_auction table
| FIELD_NAME |
DATA_TYPE |
SIZE |
DESCRIPTION |
| AUCTION_ID |
INT |
[10] |
NOT NULL(PRIMARY KEY) |
| CROP_ID |
INT |
[10] |
NOT NULL |
| AUCTION_DATE |
DATE |
|
NOT NULL |
| REGIS_ID |
INT |
[10] |
NOT NULL |
| AMOUNT |
INT |
[10] |
NOT NULL |
5.5.5 Database for Complain:
Table 5.5: Complain table
| FIELD_NAME |
DATA_TYPE |
SIZE |
DESCRIPTION |
| COMPLAIN_ID |
INT |
[10] |
NOT NULL(PRIMARY KEY) |
| COMP_DATE |
DATE |
|
NOT NULL |
| REASON |
VARCHAR |
[255] |
NOT NULL |
| COMP_REGIS_ID |
INT |
[10] |
NOT NULL |
| REGIS_ID |
INT |
[10] |
NOT NULL |
| STATUS |
INT |
[1] |
NOT NULL |
5.5.6 Database for Confirm_auction:
Table 5.7: Confirm_auction table
| FIELD_NAME |
DATA_TYPE |
SIZE |
DESCRIPTION |
| CONFIRM_ID |
INT |
[10] |
NOT NULL(PRIMARY KEY) |
| CONFIRM_DATE |
DATE |
|
NOT NULL |
| REGIS_ID |
INT |
[10] |
NOT NULL |
| CROP_ID |
INT |
[10] |
NOT NULL |
| AUCTION_ID |
INT |
[10] |
NOT NULL |
| FINAL_AMT |
INT |
[10] |
NOT NULL |
5.6 CANVAS
5.6.1 AEIOU Summary
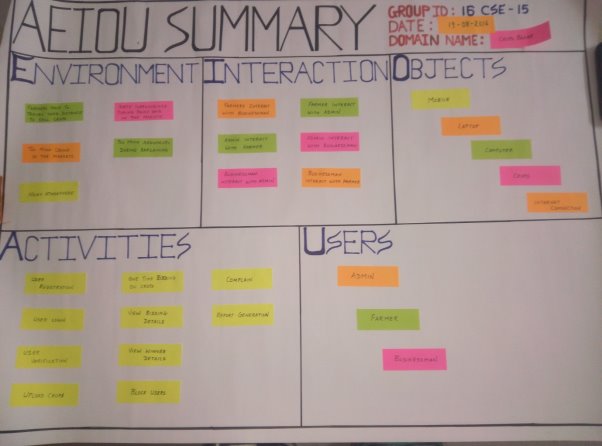
Figure 5.22: AEIOU Summary
Description:
Environment:
Environment describes the weather and atmospheric condition of a particular place at a given point of time. The environment in which this application will be used can be dusty, warm, crowded or noisy place. The place can also be AC rooms, offices, godowns. Depending upon these weather condition there can occur certain issues while using the application like connectivity problem, application failure, etc.
Interaction:
User will be interaction with this system to sell or buy the crops. The farmer will interact to upload his crops for selling while the businessman will interact to buy the crops by bidding for the crop. The admin will also interact to keep the track of all the activities of the user.
Objects:
The objects that will be used while using this system are mobile, laptop, computer, crops and internet connectivity. The problems that may occur while using these objects are bad internet connection, improper working of mobiles or laptops or computers.
Activities:
The various activities that are performed while running the application are user registration, user login, user verification, uploading crops, one time bidding for crops, view winner details, block fraud users, complaining and report generation.
Users:
The users using this system can be admin, farmer and businessman. The admin will keep track of all the activities of farmer and businessman. The farmer will upload his crops for sell, select the appropriate winner and the businessma will buy crops by performing one time bidding for the crops.
5.6.2 Ideation canvas
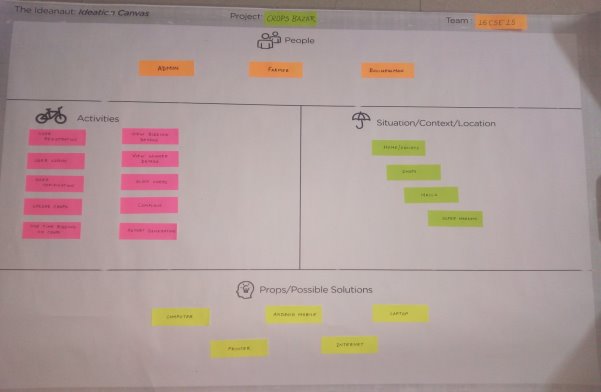
Figure 5.23: Ideation canvas
Description:
People:
This system is useful and will solve the many problems of the people like farmer and businessman. The users involved in this system are admin, farmer ad businessman.
Activities:
The various activities that are performed while running the application are user registration, user login, user verification, uploading crops, one time bidding for crops, view winner details, block fraud users, complaining and report generation.
Situation/Context/Location:
The situation can be different for different places. For example, at market places the situation can be crowded, cool, dirty, noisy, etc. It can also be offices or godowns.
Props/Possible Situation:
The different props that will be used while creating and using the system are mobile, laptop, computer, printer and internet connection.
5.6.3 Empathy Summary
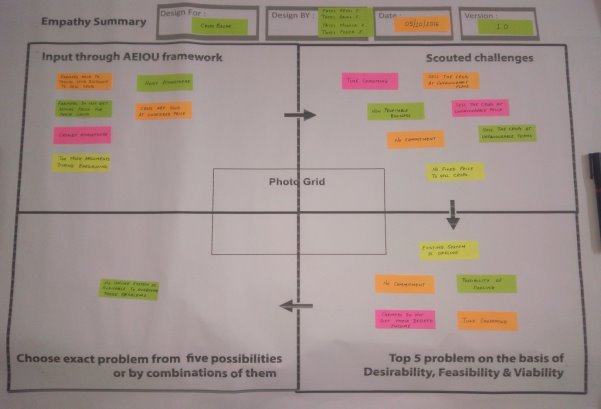
Figure 5. 24: Emapthy summary canvas
Description:
Input through AEIOU framework:
The AEIOU framework gives us the summary of activities, environment, interaction, objects, and users involved in the system. The activities performed are uploading crops for selling and one time bidding for buying the crops. The environment while using the system can be crowdy, noisy, warm or cool. The interaction involved in the system can among farmer and businessmen or farmer and admin or businessman and admin. The objects used in the system are mobile, laptop, computer, and internet connection. The users involved are admin, farmer and businessman.
Scouted Challenges:
The challenges faced while using the system are time consuming, non-profitable business, no commitment, there is no fixed price to sell the crops, sell the crops at unfavourable place, price or terms. Among these problems the exact problem is no offline system is available to overcome these problems.
5.6.4 Product Development canvas
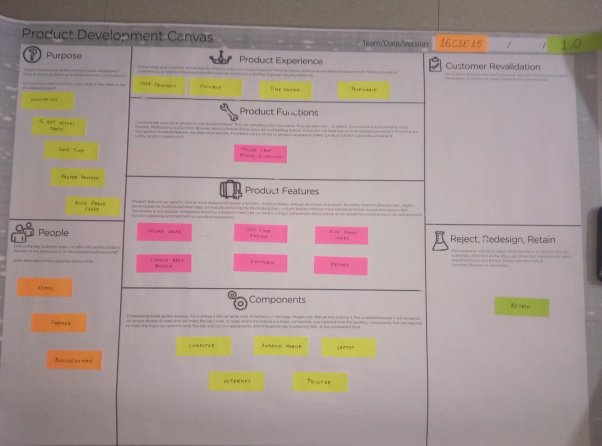
Figure 5.25: Product Development canvas
Description:
Purpose:
Our system targets at removing the problems of farmers in selling their crops as in offline system the farmers do not get the actual price for their product and they are fooled the the mediators. This system will eliminate this problem and avoid fraud users.
Product Experience:
This system is also created on android platform so the users can easily download it in their mobile and can use the system. This system will avoid the farmers from being fooled by the businessman and it is also profitable.
Components:
As we are also making the android application, it can be easily downloaded in the mobile phones and used through internet connection. Internet connection is necessary for using this system.
People:
The people using this system can be admin, farmer and businessman. The admin will keep track of all the activities of farmer and businessman. The farmer will upload his crops for sell, select the appropriate winner and the businessman will buy crops by performing one time bidding for the crops.
Product Functions:
Product function delivers the product experience. The main function of this system is online crops buying and selling between the farmer and the businessman.
Product Features:
The features that we have included in our system are uploading crops, one time bidding for crops, view winner details, block fraud users, choose best bidders, complaining and report generation.
5.6.5 Business Model canvas
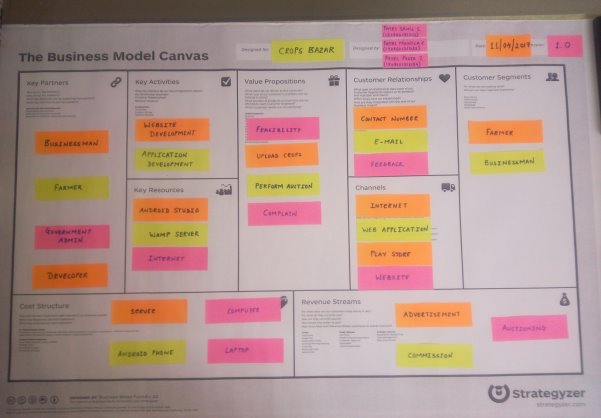
Figure 5.26: Business Model canvas
Business model canvas is used to validate the market significance of products and services which will be of technology nature in this case. Technology projects are often solutions or processes that solve a technical problem.
However the market implementation of such solutions also require that the problem solution is designed to overcome not just the technical barriers but also market and business related barriers of costs, customer reach and collaborations and those that pertain to the practical nature of limited initial capacities within the team.
Thus business model canvas can be used to visualize such market problems and customer expectations. This exercise will increase the market potential and penetration of technology goods and services. This will make them more effective in market.
Customer Segment
Customer Segment block is to present the list of Personas, organized by Customer Segment. If you have more than one segments. It is always recommended to prioritize them.
Examples:
Value Propositions
The collection of products and services a business offers to meet the needs of its customers. The value proposition provides value through various elements such as newness, performance, customization, “getting the job done”, design, brand/status, price, cost reduction, risk reduction, accessibility, and convenience/usability.
Examples:
- Upload Crops
- Perform Auction
- Complain
Channels
This business block comprises of a list of important Channels, linked to Personas or Segments if they differ substantially. Effective channels will distribute the system’s value proposition in ways that are fast, efficient and cost effective. An organization can reach its clients either through its own channels, partner’s channels or a combination of both.
Example:
- Internet
- Web application
- Play store
- Website
Customer Relationships
The customer relationship business block answers the following questions:
- What type of relationship does each of our Customer Segments expect us to establish and maintain with them?
- Which ones have we established?
- How are they integrated with the rest of our business model?
- How costly are they?
Examples:
- Contact Number
- Email
- Feedback
Revenue Streams
The way a company makes income from each customer segment. Several ways to generate a revenue stream through our system are:
- Advertisement
- Auctioning
- Commission
Key Activities
It specifies the most important activities in executing a system’s value proposition.
Example:
- Website Development
- Application Development
Key Resources
This segment of the business model canvas answers the following questions:
- What Key Resources do our Value Propositions require?
- Our Distribution Channels?
- Customer Relationships?
- Revenue Streams?
Examples:
- Android Studio
- Wamp Server
- Internet
Key Partners
This section comprise of the core parts of project. Like key partner, key supplier and key resources.
Example:
- Developer
- Government Admin
- Farmer
- Businessman
Cost Structure
Cost Structure business block provides a list of Cost Structure elements with notes on their relationship to Key Activities.
Examples:
- Server
- Android Studio
- Computer
- Laptop
Chapter 6:- IMPLEMENTATION
6.1 TESTING
Software testing is an investigation conducted to provide stakeholders with information about the quality of the product or service under test.Software testing can also provide an objective, independent view of the software to allow the business to appreciate and understand the risks of software implementation. Test techniques include the process of executing a program or application with the intent of finding software bugs (errors or other defects), and verifying that the software product is fit for use.
Software testing can provide objective, independent information about the quality of software and risk of its failure to users or sponsors.
There are many approaches available in software testing. Reviews, walkthroughs, or inspections are referred to as static testing, whereas actually executing programmed code with a given set of test cases is referred to as dynamic testing. Static testing is often implicit, as proofreading, plus when programming tools/text editors check source code structure or compilers (pre-compilers) check syntax and data flow as static program analysis. Dynamic testing takes place when the program itself is run. Dynamic testing may begin before the program is 100% complete in order to test particular sections of code and are applied to discrete functions or modules.
Static testing involves verification, whereas dynamic testing involves validation. Together they help improve software quality.
Software testing is used in association with verification and validation:
- Verification: Have we built the software right? (i.e., does it implement the requirements).
- Validation: Have we built the right software? (i.e., do the deliverables satisfy the customer).
Verification is the process of evaluating a system or component to determine whether the products of a given development phase satisfy the conditions imposed at the start of that phase.
Validation is the process of evaluating a system or component during or at the end of the development process to determine whether it satisfies specified requirements.
6.2 TEST CASE
