Content
Abstract
1. Introduction
2. Material and Method
2.1 The Real Options Milling model (ROM)
2.1.1 Net present value (NPV)
2.1.2 Option Value (OV)
2.2 Data
2.3 Software
2.4 Correlation matrix
2.5 Distribution fitting
2.6 Personal conversation
3. Results and Discussion
3.1 Correlation matrix
3.2 Distribution fitting
3.2.1 Wheat price
3.2.2 Flour price
3.4 Personal conversation results
3.4.1 Cost of learning
3.4.2 Scenarios
3.5 The Real Options Milling model (ROM)
3.5.1 Mills’ decisions are influenced by flour yield and storage capacity
3.5.2 Mills’ decisions are driven by the wheat price differential
3.5.3 Mills’ decisions are more driven by the wheat price differential or wheat quality?
3.6 Option Value (OV)
3.7 Willingness to pay (WTP)
4. Conclusion and future implications
Appendix 1
Appendix 2
Reference
Abstract
Indonesian mills primarily use American soft white wheat (SWW) to make the flour for the large and growing cake and biscuit market. Following recent research, it is believed that Australian Noodle Wheat 2 (ANW2) has similar functionality when milled, and may compete strongly in this market. However, Indonesian mills may be reluctant to switch from using SWW to ANW2, due to limited storage capacity and uncertainties in wheat price, flour yield and the effect on flour quality. This project aims to apply the Real Options Approach to examine the decision-making rationale for Indonesian mills switching from SWW to ANW2, given the uncertainties associated with using ANW2. The findings suggest that Indonesian mills are willing to bear a cost in learning and delaying the purchasing decision in order to resolve uncertainty over the quality of ANW2. However, earlier access to ANW2 is indicated when the wheat price differential is significant. Mills with higher storage capacity are better placed to switch earlier. These results identify target mills for grain marketers. This study provides the Australian wheat industry with a better understanding of the drivers that influence mills to switch wheat supply, which will assist marketers in developing strategies to influence or promote? the purchase of Australian wheat.
1. Introduction
Australian Noodle Wheat (ANW) is a wheat class that Japan and South Korea demand for udon noodle production due to its specific starch gelatinisation characteristics. In order to be classified as ANW1, wheat receivals need to fall within a tight protein window of 9.5-11.5% (Grain Trade Australia, 2016). Weather fluctuations and the range of farming practices impose variability risks on farmers and they cannot guarantee that their wheat’s protein level will always lie in this range. Grain that falls outside of the 9.5-11.5% protein range is classified as ANW2 (Grain Trade Australia, 2016).
The price of ANW2 shows higher variance than the other comparable wheat classes. For example, in February 2014 the price obtained for ANW2 was nearly equivalent to the high quality ANW1, but by August to October in the same year the price offered to farmers for ANW2 was below the feed wheat price, with feed wheat generally considered the lowest quality wheat (Siah et al., 2016). This price volatility is primarily due to limited direct demand as there are currently no end-products that specifically require ANW2 quality wheat (Siah et al., 2016). The Australian Export Grains Innovation Centre (AEGIC) has identified a potential of ANW2 for the production of cake and biscuits for Indonesia and research is underway to confirm this opportunity. For the purpose of this thesis the assumption has been made that ANW2 is suitable for this market.
Indonesia is the largest importer of Australian wheat, with a value of $1.29 billion in 2015, accounting for 21% of total Australian grain exports in that year (Australian Export Grains Innovation Centre, 2015). Australian wheat generally accounts for 40-69% of annual Indonesian wheat imports (Grain Growers, 2016). In particular, Indonesian buyers consider Australian white wheat as a superior choice for noodles, with its colour, colour stability and texture properties highly valued (Grain Growers, 2016).
In Indonesia, approximately 52% of flour goes into the production of noodles, 22% for breads, 4% for biscuits and 2% for cakes (Welirang, 2017). The consumption of cake and biscuit products in Indonesia is growing steadily, by approximately 1,000 tonnes a year since 2011 (Euromonitor, 2016). This is largely driven by the wider distribution networks of manufacturers and the rapid expansion of retail outlets across the country, especially the rise of convenience stores. Urban consumers are living increasingly busy lives and prefer to consume ready-to-eat and convenient breakfast items and/or snacks between meals or both (Euromonitor, 2016). This, includes many types of baked goods (Euromonitor, 2016).
Currently, Indonesia’s soft wheat market is dominated by the United States, where Soft White Wheat (SWW). American SWW is used in production of flour destined for Indonesian cake and biscuit products. It has been reported that Indonesia purchased 345,400 tonnes of U.S. wheat in 2103/14 (June/May) and 59% was soft white wheat (Pastor and Scoville, 2013). While the Indonesian mills are currently using SWW, Australia is positioned to supply ANW2 into the Indonesian market at a competitive price. ANW2 has similar quality attributes to SWW (Siah et al., 2016).
Despite the possibility of price and freight advantages inherent in a switch to ANW2, other factors influence the decision to continue using SWW. This behaviour could be interpreted as the action of a risk averse agent, or accepting the cost of holding an option to switch to ANW2 at a later date when uncertainty regarding supply, freight and price are resolved. There is currently a research gap in understanding the key drivers of this decision. The current understanding is that these key drivers are not always fixed values. The price differential between the two classes is variable, as is supply, as is quality.
A flour mill’s approach to managing risk and the costs of purchasing wheat from a new origin can be analysed using economic models. Mill managers can build a management economic model in Microsoft Excel spreadsheets and parameterise the models, for example making specific changes in the mill’s input cost structure to analyse the effects on mill efficiency, earnings, and returns (Elieser S. Posner and Hibbs, 2005). The real options approach (ROA) is a recent method, applicable to this type of problem and extends risk analyses to more difficult choices, such as whether to accept or defer new investments, expand or abandon the operation, and switching inputs or outputs (Hertzler et al., 2013). ROA is often used when expected returns are variable and costs are indivisible and irreversible (Featherstone and Kastens, 2000; Hertzler et al., 2013). This project has selected the ROA, because the shipment cost of wheat to a mill is largely indivisible. Mills purchase a ship load of wheat (or a hatch), which could be 10,000 to 60,000 tonnes at a time, due to the irreducible size of the ship. Another example of the appropriateness of ROA is when quality differences require significant investment costs to recalibrate the infrastructure, which may be partially or completely irreversible, and there is a real effect on the quality of the product and on the market for that product. For these reasons, this project has selected the ROA to identify the conditions under which an Indonesian mill is likely to switch from American Soft White Wheat (SWW) to Australian Noodle Wheat (ANW2).
Hypothesis: Indonesian millers choose to accept a known cost, to delay the decision on whether to switch from purchasing SWW to ANW2, with which to supply their customers with flour suitable for cake and biscuit making. To paraphrase, in order to resolve uncertainty over the quality of ANW2, millers are willing to bear a cost in learning, prior to committing to purchase.
2. Material and Method
2.1 The Real Options Milling model (ROM)
The Real Options Milling model (ROM) is an economic model developed for this study. It has been adjusted based on the ‘Flour Milling Feasibility Template’ designed by Oklahoma State University (Rodney and Holcomb, 2004). While the original model was developed using units of ‘bushels’ and ‘$/bu’, for the purpose of this study the values in the model have been converted to ‘tonnes’ and ‘$/t’ by multiplying the values by 36.743 (U.S Wheat Associates, 2017). The ROM had five main components: management options, control functions, input values, variable cost, fixed cost, calibration cost, output values and financial outcome (Figure 1).
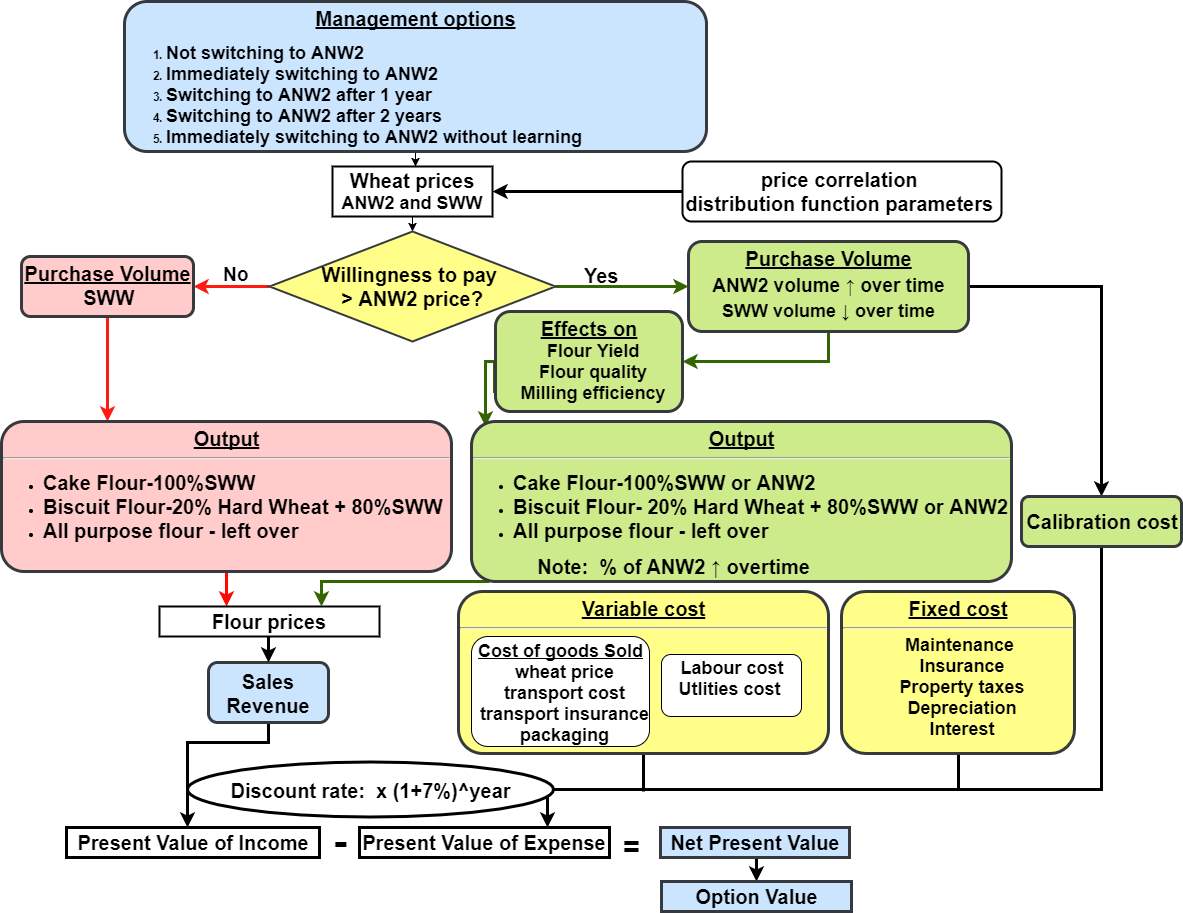
Figure 1. The flow chart of applying the Real Options Approach in modelling Indonesian mills’ decisions. Willingness to Pay (WTP) is the maximum amount the investor accepts to pay for the investment (Le Gall-Ely, 2009). A $10 WTP means that the mill is only willing to switch, if ANW2 is at least $10 cheaper than SWW.
The management options available to the mill were whether to accept, delay, or suspend the opportunity of switching to ANW2. Control functions included the mills’ willingness to pay, and willingness to invest in learning about how to use ANW2 (calibration cost). Low storage capacity means that the mills have limited storage and it is costly for mills to switch back to SWW after purchasing ANW2, hence an element of irreversibility. High storage capacity means that the mills can have multiple switches between SWW and ANW2 as long as the price differential exceeds their willingness to pay (WTP). Quality differences will affect flour yield, flour quality and milling efficiency.
Input values included wheat prices, and purchasing volume. Minor adjustments have been made on the variable and fixed costs stated in the original template so that the ROM will reflect the costs in Indonesia. The calibration cost has been assumed as a calculated cost that includes the additional labour and utility costs generated from re-calibrating mill settings and the cost of training on how to optimise the ANW2’s flour performance in making cake and biscuits. The calibration cost is included when the mill first considers using ANW2. The cost will last for a three-year period but decreases each year. The effect of the calibration and learning is uncertain, but there is a higher probability (60%) that the mill will be more efficient in using ANW2 if the calibration cost is accrued.
As this project focused on wheat that is well suited to making cakes and biscuits, the outputs in the ROM were cake flour, biscuit flour and all-purpose flour, priced from highest to lowest respectively. The ‘output’ box Figure 1’s has outlined the composition of each flour. As weekly flour price data was not available, the flour prices were collected from the Alibaba site of PT. Bungasari Flour Mills Indonesia (Alibaba, 2017). Alibaba is a leading global online trading platform that has been operating since 1999. Therefore, the prices on the website are suitable for making assumptions on flour price.
The financial outcomes calculated from the ROM were the Net Present Value (NPV) (see Section 2.1.1 Net present value (NPV)) and Option Value (OV) (see Section 2.1.2 Option Value (OV)). The ROM collated the data from the Monte Carlo simulation. The Monte Carlo simulation calculated the results through completing 5000 iterations, each time sampling a different set of random values that lie within the probability distributions for each stochastic input. In the end, the Monte Carlo simulation produced a distribution of the possible outcome values and indicating the NPV’s mean for each management option (Palisade Corporation, 2017; Petersen et al., 2010). The OV is the NPV difference between an option that includes the cost of learning (Figure 1 ‘Management options’ no.2, 3 and 4) with the NPV of immediately switching without learning how to optimise the ANW2’s flour performance (Figure 1 ‘Management options’ no. 5).
2.1.1 Net present value (NPV)
NPV is widely used in the agriculture industry as it is a valid approach to assess and compare the return of available investments (Maart-Noelck and Musshoff, 2013). NPV is consistent with the company’s objective of maximising shareholders’ wealth (Brealey, 2016). The NPV calculates the estimated profitability of an investment by considering the current value of future cash flows (Newbery, 1981; Ryan, Patricia A and Ryan, 2002).
|
NPVt=-CF0+∑i=1nSCFt(1+r)2 |
( 1 ) |
Where,
r is the interest rate (%)
CF0
is the initial investment
CFt
is the cash flow at terminal node t
The management option that has the highest Net Present Value (NPV) generates the greatest profit for the mill. However, options with the highest NPV does not necessary mean that it is the best option for the mill. In this project, the ROM has built uncertainty into the NPV methodology by considering flexibility or uncertainty in the timing of the wheat switching investment, which is illustrated by the Option Value (OV) (see Section 2.1.2 Option Value (OV)).
2.1.2 Option Value (OV)
Option Value evaluates the profit Indonesian mills will gain from delaying and learning about ANW2, before purchasing. The strategic real options (SRO) for mills switching to ANW2 has been calculated using the following formulae (Kofman and Pinder, 2016; Pažek and Rozman, 2012):
