Table of Contents
COPYRIGHT
DECLARATION
DEDICATION
ACKNOWLEDGEMENTS
LIST OF FIGURES
LIST OF TABLES
LIST OF ABBREVIATIONS
LIST OF EQUATIONS
Abstract
1 introduction
1.1 Introduction
1.2 Background
1.3 Problem Statement
1.4 Aim
1.5 Objectives
1.6 Research questions
1.7 Justification
1.8 Scope
1.9 Methodology
1.10 Expected results
1.11 Conclusion
2 LITTERATURE REVIEW
2.1 Introduction
2.2 Tarmac surfaces
2.2.1 Concrete Pavements and Mixes
2.2.2 Asphalt Pavements and Mixes
2.2.3 Transport of Heat
2.2.4 Conduction
2.2.5 Convection
2.2.6 Radiation
2.3 Tarmac surface thermal behaviour
2.3.1 Thermal Conductivity
2.4 Factors Affecting Thermal Conductivity
2.4.1 Aggregate type and content
2.4.2 Specific Heat Capacity
2.4.3 Thermal Diffusivity
2.4.4 Thermal Effusivity
2.4.5 Pavement Heat Collector Systems
2.4.6 Applications and Design Considerations
2.4.7 Commercial Systems
2.5 Materials Selection
2.5.1 High Thermal Conductivity Aggregates.
2.5.2 Pipe material.
2.5.3 Heat exchange fluid.
2.5.4 Surface coating.
2.5.5 Geometrical And Working Parameters
2.6 Central Heating Systems
3 Research methods
3.1 Introduction
3.2 Data collection
3.3 Primary sources
3.3.1 Interviews
3.3.2 Questionnaires
3.3.3 Meta-analysis
3.4 Secondary sources
3.4.1 Previous research
3.4.2 Official statistics
3.4.3 Government reports
3.4.4 Internet
3.4.5 Library research
3.4.6 Engineering tool
3.4.7 Microsoft office
3.4.8 Excel spreadsheet:
3.4.9 Microsoft word
3.4.10 Microsoft Visio
3.4.11 Autodesk inventor
3.4.12 AFT Mercury
3.4.13 AFT Fantom
3.5 Conclusion
4 Results and discussion
4.1 Introduction
4.2 Questionnaire findings
4.2.1 End user perception
4.2.2 Average hot water consumption per day
4.3 Experimental results
4.3.1 Comparison Of Different Material Properties
4.3.2 Effect Of Changing Pipe Diameter
4.3.3 Effect Of Changing Pipe Spacing
4.3.4 Effect Of Changing Fluid Velocity
4.3.5 Effect Of Changing Pipe Depth
4.3.6 Load Analysis
4.3.7 Finite Element Result Analysis
4.4 Conclusion
5 CONCEPT GENERATION AND DESIGN
5.1 CONCEPT GENERATION
5.2 Introduction
5.3 Design Brief
5.3.1 Quality Function Deployment
5.3.2 Concept one
5.3.3 Concept two
5.3.4 Concept three
5.4 Concept selection
5.5 DESIGN CALCULATIONS
5.6 Energy That Can Be Harvested From The Tarmac Surface
5.6.1 Ridgeview roads Tarmac surface area
5.6.2 Solar radiation absorbed by pavement
5.6.3 Thermal radiation emitted by the asphalt
5.6.4 Thermal radiation absorbed from the atmosphere
5.6.5 Total energy that can be harvested
5.6.6 Energy required to raise water by 20 degrees Celsius
5.6.7 Actual energy that can be harvested
5.6.8 Heat conduction through the pavement
5.6.9 Heat conduction through the pipe
5.6.10 Heat convection between water and pipe
5.6.11 Heat convection between the pavement surface and the ambient
5.7 Design For Water Demand
5.7.1 Assumptions
5.7.2 Hot water usage allocation
5.7.3 Maximum Water Demand/day
5.7.4 Supply flow rate
5.7.5 Collector Pipe length that can be installed
5.7.6 Total length of collector pipes (
ρ= density (kg/m3)
According to Asaeda et al. (1996) the larger the diffusivity, the faster the propagation of heat into the medium. A small value of thermal diffusivity means that heat is mostly absorbed by the material and a small amount of heat will be conducted further. Mrawira and Luca (2002) set up an experiment to determine the thermal diffusivity of pavements and the prediction could be made from the following equation
i= time node
m=depth node
2.4.4 Thermal Effusivity
In 1983 tom Duncan stated that thermal Effusivity (β), refers to the ability of a material to transfer heat to and from the surrounding areas. It can also be termed coefficient of heat storage, the equation below can be used to calculate thermal Effusivity of a material.
β=λ×ρ×cp.………………….Equation 2‑8
Where,
β=thermal effusivity (J/S0.5m2K
)
A large value of thermal Effusivity indicates both large storage capacity and efficient heat
transfer.
2.4.5 Pavement Heat Collector Systems
Wu et al. (2011) stated that a maximum of 70°C can be achieved by the tarmac pavements in summer because of abundance of solar irradiation and excellent absorbing properties of tarmac. In 2003 de Bondt outlined that heat energy that is taken up by the tarmac surfaces can be gathered by the use of pipes called loops that are embedded beneath the pavements. (Carder et al.2007) further added that the absorbed heat can be used for many different applications including de-icing roads, provide hot water or converted to electricity using the thermos electric generator. (Mallick et al. 2009; Wu et al. 2011). Made it clear that the reduction in temperature from the surface of pavements would lower the urban heat island (UHI)
2.4.6 Applications and Design Considerations
Turner (1986; 1987) studied, theoretically, the performance of a pavement heat collector lower temperatures of maximum 15°C and higher temperature of 70°C for applications like de-icing roads, provide hot water or converted to electricity using the thermos electric generator He concluded that from his results it was possible to apply this technology in the stated applications. Nayak et al. (1989) did experimental studies on collecting solar energy from embedded PVC tubed under a painted black concrete roof top. They presumed that solar powered collectors can be implemented for use in homes as a way of reducing water heating costs.
Chaurasia (2000) contemplated the execution of a solid sun oriented authority by setting out a system of aluminium loops to provide hot water for use in homes. The conclusion was that at a solar radiation conditions of 650 W/m2 and air temperature of 27°C a range of 36°C and 58°C outlet can be achieved. Hasebe et al. (2006) worked on a project that utilizes thermoelectric generator and the temperature difference between warm inlet water and cold water as supplied from external source.
Mallick et al. (2009) examined tarmac surfaces for utilizations of collecting vitality and lessening the UHI impact. They hypothetically demonstrated that close surface air temperature could be lessened as much as 10°C by running water through the implanted loops put at around 40 mm under the asphalt. Also, they played out a little scale research facility testing on black-top asphalt tests. Their outcomes demonstrated that dark acrylic paint on the tarmac surface and supplanting limestone aggregates with aggregates containing high rates of quartz could expand the proficiency of the system by half and 100%, respectively. Wu et al. (2011) showed that running water in pipes could reduce the surface temperature of the pavements hence provided evidence of considerable heat absorption of water see Figure 2:3).
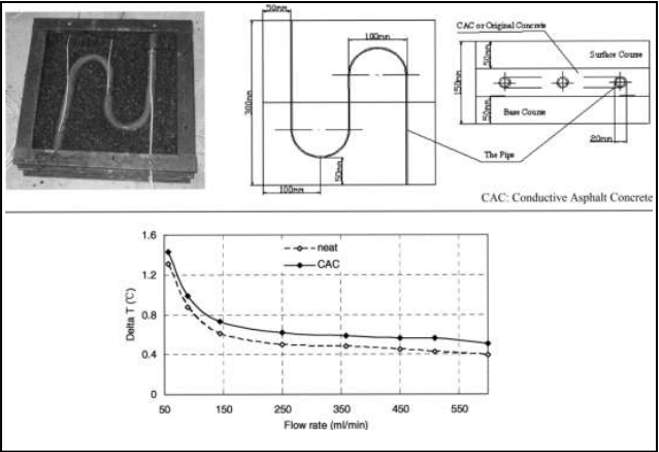
Figure 2:3 tested asphalt slabs (top) and temperature rise as a function of flow rate (bottom) for normal and conductive asphalt slabs, adapted from (wu et al. 2009)
Wu et al. (2009) also said that application of graphite could raise the outlet water temperature of tarmac surfaces see Figure 2:3 . However, they understood that long loops and a bigger zone of heat exchange is important to gain a significant temperature rise. Moreover, the lubricant impact of graphite may negatively affect the mechanical execution of tarmac surfaces.
2.4.7 Design Considerations
In 2017 Richard W. and Bonds, P.E showed some relation between the truck load and their effect on the pipes buried at shallow depths. The procedure for coming up with the load is provided in ANSI/AWWA standard C150/A21.50. The equations shown below were taken from these standards.
Truck load (
Pt N/mm2)
Pt=RF×CPbD
Where
Pt = Truck load in pounds per square inch
R = Reduction factor (see appendix 4 C150/A21.50). The reduction factor considers the load from the wheel which is taken by the pipe that is directly below it but the pipe is assisted in carrying the load by the distribution of the load due to the top layer of the tarmac causing other adjacent pipes to carry part of the load.
F = Impact factor =1.5 (ASCE Manual No. 37)
C = Surface load factor gives the relation of load distribution from the surface through the soil to the pipe. (C150/A21.50)
P = Wheel load (N) (for purposes of design, 16,000 lbs., for a single AASHTO H-20 truck on unpaved road or flexible pavement)
b = Effective pipe length of 36 inches
D = Outside diameter of the pipe in inches
Surface load factor (C).
=1-2πsin-1HA2+H2+1.52A2+H21.52+H2+2π1.5AHA2+H2+1.521A2+H2+11.52+H2
H = Depth of cover in meters
A = Outside radius of the pipe in meters
Stress at any known depth
σZ=3P2πH3R15
Where
σZ=
Vertical stress in pounds per square inch
P = Point load at surface in pounds
H = Depth in inches
R = Distance from the point load to the point at which the stress is to be determined in inches
2.4.8 Commercial Systems
According to de Bondt (2003), the application of pavement energy system has been constrained but there are some popularized frameworks which have been implemented successfully by Ooms Avenhorn in the Netherlands. The general outlook of the system is shown in Figure 2:4 below. The system makes use of buried loops which contain a heat absorbing liquid.
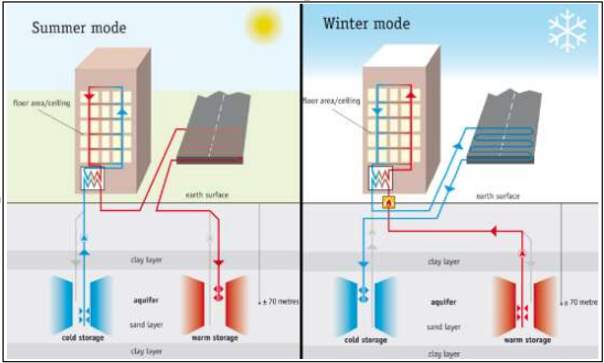
Figure 2:4 Road Energy System Innovated By Ooms Avenhorn Holding (De Bondt 2003)
In 2012 P.K.Dehdezi explained that in summer, low temperature water is pumped into the loops buried under the tarmac surface and begins to circulate. The heat being absorbed by the tarmac surface is then conducted to the loops/pipes buried thereby increasing the temperature of the liquid. The warm water can then be kept in a reservoir storage for later use (Figure 2:4).
Experiments have been conducted by the Ooms to determine the effects laying the pipes under the tarmac surface including the effects of compaction on the integrity of the pipes. According to Van Bijsterveld and de Bondt (2002) the insertion of pipes compromises the strength of the tarmac surface due to the stress concentrations close to the pipe. Bondt and his friends also engineered a way to prevent this effect, it makes use of the reinforcing grid that protects the pipes in three dimensions as shown in Figure 2:5 below. The structure protects also the pipes from concentrated stresses and compaction damage.
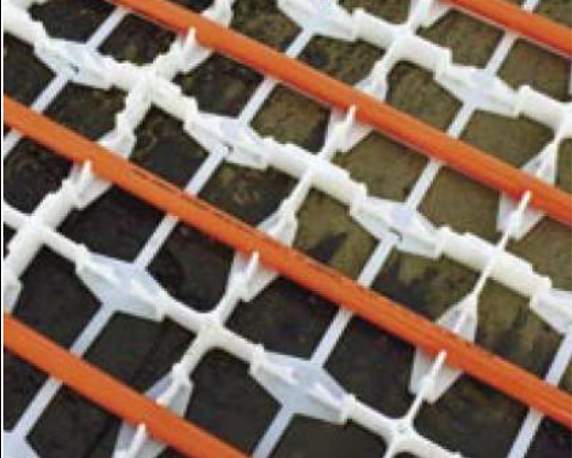
Figure 2:5 Three-Dimensional Reinforcing Grid Developed By Ooms Avenhorn Holding, Carrying Water Pipes Are In Red (De Bondt 2003)
In 2012 P.J Dehdezi pointed that a special type of bitumen polymer known as Sealoflex was developed to obtain a high quality tarmac blend to be used between the loops and the grid.
Sullivan et al. (2007), said that the system has been successfully implemented in the UK. IcaxTM Limited in the UK. This system absorbs energy from the upper installed pipes and it stores then in the lower installed pipes (see Figure 2:6). Carder et al. (2007)
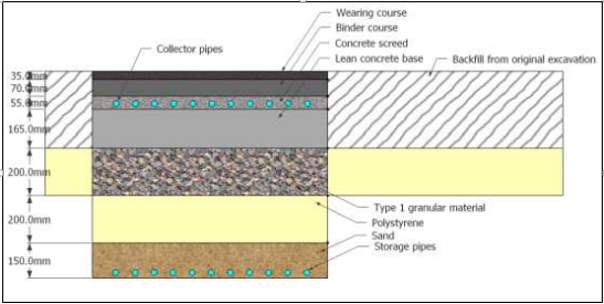
Figure 2:6 collector and storage system set up
Figure 2:7 Cross Section Of Collector And Storage Loops In The Icax System, Adapted Form (Carder Et Al. 2007)
2.5 Materials Selection
A wide range of heavy, light, normal and other aggregates, can be used to improve the thermos-physical properties of pavement energy systems. As well as were used to produce concrete and asphalt pavements that might deliver beneficial thermo-physical properties for the PESs. The effects of different combinations of material is analysed by different authors shown in the following paragraphs.
2.5.1 High Thermal Conductivity Aggregates.
Raising thermal conductivity by addition of additives as graphite or quartz has been done by or quartz. Hermansson A. (2000) carried out studies and showed that two samples one with and one without aggregates have different conductivities, the one with additives had better conductivity. In 2003 V. Bobes-Jesus et al said efficiency of the collector can be improved by the additives. In 2004 Mallick et al. managed to increase the conductivity in their attempt they added copper powder which has a high conductivity. As surface temperature decreases underground temperature increases with depth therefore increasing the thermal conductivity of material in by increasing thermal conductivity increases heat transfer process Wu S, Chen M, Wang H, Zhang Y .(2009).
2.5.2 Pipe material.
Because of their high conductivity metallic pipes can be used, however nowadays PVC pipes are most preferable in order to bypass the complications posed by metallic pipes such as corrosion. According to V. Bobes-Jesus et al.(2013) a material called radiant ONIX has conductivity 0.29 W m1 K1 only produced a slightly lower difference between highest temperature reached when it was compared to copper in an experiment signifying that cheaper materials than copper can be used.
2.5.3 Heat exchange fluid.
According to Hasnain SM in (1998), availability, low cost, effect on pipes, stability at the associated temperatures, high specific heat are the qualities required for a heat exchange fluid. He also said that water is the most suiting fluid but it is much better when mixed with anti-freeze to avoid solidification. Anti-freeze like Glycols are mostly associated with this application as they have high specific heat, low viscosity, moderate cost and ease corrosion control among many other properties commonly used antifreezes due to their moderate cost, high specific heat, low viscosity and ease of corrosion control Zwarycz K. (2002) and Wang H, Qi C (2008).
2.5.4 Surface coating.
According to Mallick et al. (2009). The behaviour of tarmac is such that it mimics the behaviour of a black body which high quantities of solar radiation but it also releases longwave thermal radiation at speedy rates. For this reason. By reducing the reflectivity of tarmac surfaces by means of applying a black paint the collector efficiency can be improved. However the rate of emission is still high.
2.5.5 Geometrical And Working Parameters
the following sub chapters points out the effect of some geometrical and design factors such as pipe depth, pipe arrangement, pipe spacing, flow rate, and pipe diameter, on tarmac solar collector functionality is examined.
2.5.5.1 Pipe diameter.
V.Bobes-jesus et al. (2012).reviewed that the flowing of the liquid depends greatly upon the diameter of the pipe. The thermal diffusivity decreases when the diameter increases under assumed constant flow as suggested by the Dittus-Boeltler correlation. Flow conditions depend strongly on pipe diameter.
2.5.5.2 Pipe spacing
If the number of pipes increase per area then heat absorption increases but the outlet temperature is decreased because of heat distribution, Bijsterveld WT et al, (2001). On the other hand if the spacing too low the efficiency of the collector is greatly reduced cool zone formations. The minimum spacing of the pipes depends upon the diameter of the pipe and the rate of flow. R.B Mallick et al. (2009). Also the economic consideration must not be ignored during selection of pipe spacing.
2.5.5.3 Pipe depth
There is an occurrence of thermal gradient in any tarmac surface as the distance from the surface increases. LTPP said that the maximum temperature of tarmac surfaces is at its highest at a depth of 20mm as measured from the surface of the tarmac due to the convection between the surroundings and the tarmac. The 20mm hence becomes most favourable for placement of pipes Chen B, Rockett L, Mallick RB. A. (2008). According to Loomans M, Oversloot H, and de Bont a, Jansen R, van Rij H. (2003). The distribution of pavement temperature tends to be unvarying as the depth of the pipes increases but the total amount of energy that the system is able to absorb from the surface reduces.
2.5.5.4 Pipe Arrangement.
According to V.Bobes-jesus et al. (2012). This plays a critical role in the performance of tarmac heat collectors yet no specific studies on the subject have been found in literature. They also said that there are two kinds of arrangements that are preferable namely parallel arrangement (PTC) and serpentine fashion arrangement (STC). Asphalt solar collector pipe arrangements have been found so, in this section conclusions obtained from studies on fluid mechanics of flat plate collectors are presented. According to Chiou JP. (1982) maintaining the same flow in pipes will increase the efficiency of the system otherwise 2% to 20 % of the heat may be lost. . Molero N, Cejudo JM, Dominguez F, Rodríguez E, Carrillo A. (2009). And Matrawy. (2009) showed by comparison that the serpentine arrangement is more efficient than parallel arrangement. Made a comparison between different types of pipe arrangements. Regardless of the benefits of serpentine arrangement parallel arrangement is most popular for commercial purposes. Farias et al. (1997).
2.5.5.5 Flow rate.
It is necessary to study and understand the essentials of flow rate as it has a considerable effect on the tarmacs behaviour efficiency. Different authors have outlined the following effects of flow rate on the system behaviour.
- Surface temperature and flow rate have an inverse relationship. Wu S, Chen M, Zhang J. (2011).
- Increasing flow rate does not really affect the temperature profile with depth. Wu S et al. (2011).
- Higher rate of flow leads to higher velocity and in turn an increase in the heat transfer coefficient and hence more energy can be harnessed. Wu S, Chen M, Zhang J. (2011) and Yan L, Qing G, Yong H. 2009)
- An increase in flow rate results in the rate of change in temperature of the fluid in pipes to decrease. Longer pipes will be required for the fluid to attain the temperature of the surface. At an optimum depth. Wu S, Chen M, Zhang J. (2011),
- The time required for the fluid to reach a steady state is decreased by the increase in flow rate. Inlet fluid has no effect on this time. Wu S, Chen M, Zhang J. (2011),
2.6 Central district Heating System
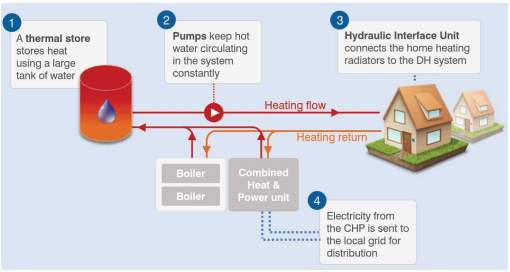
Figure 2:8 the basic concept of district heating
District heating is a network providing heat, usually in form of hot water, the heat is mainly used for space heating and for domestic hot water (drinkable water); however, It usually also meets some industrial needs. District heating systems can serve whole cities; when a system is limited to a group of buildings it is referred to as block heating. The main advantage of these systems is that the large district heating plants are more efficient, more economic and create less pollution than decentralized fossil fuel based boilers. The heat generated in a centralized manner is then distributed to urban areas through a system of pipelines specially designed for transporting heat which is then supplied house to house.
3 Research methods
3.1 Introduction
To further the understanding of the problem and the development of the most suitable solution, the following chapter was done. Different research methods were implemented which include survey, observation, questionnaire, internet research (journals), interviews and engineering tools. Data collection methods helped in discovering and gaining information, and the details are described below.
3.2 Data collection
Quantitative and qualitative (exploratory) methods of collecting the data were employed to gather as much needed data as possible. The methods are briefly described at below. Data was gathered from both primary and secondary sources.
3.3 Primary sources
3.3.1 Interviews
In order to collect adequate information about the bits of the project interviews were done in person, on the phone and through emailing. People from the construction industry, energy regulation departments and water works formed the majority of the interviewees. This helped to extract useful information on different aspects and requirements of the project.
3.3.2 Questionnaires
Questionnaires were also used in the gathering of information. Home water users were the main target for this method. Things like their daily water consumption and the amount they are required to pay for the water were part of the crucial questions asked. The information acquired helped in the prediction of the acceptability of the projects and different views also helpful suggestions were noted down through informal questioning and discussions.
3.3.3 Meta-analysis
This included the collection of and statistical analysis of analysis of the results obtained from multiple individuals for the reason of integrating the results. This gave advantage over limited resources in case of attempting to do experiments.
3.4 Secondary sources
For the purpose of comprehending time, cost and effort data was gathered from secondary sources.
3.4.1 Previous research
Much information was obtained based on the work that other researchers have done. Many concepts, experiments, statistics etc. outlined by many different researchers were compiled to come to a common ground.
3.4.2 Official statistics
The government has a vast data base containing valuable information about some important considerations for instance population increase, utility demand curves etc. these helped in the prediction of the design capacity of the system.
3.4.3 Government reports
From time to time the government releases information about challenges faced in the nation. These reports shows the areas which need attention and have been addressed.
3.4.4 Internet
This was vastly utilised in the research for the project. Multiple sources including software, research papers, communication (interviews) among many others were done through the internet.
3.4.5 Library research
3.4.6 Engineering tool
These are the tools which were utilised to enhance the minimization of time to complete the project. They provided quick results by simulation, alteration at design drawings stage, easy and smart presentation of work. All these helped to avoid producing a product that will not work hence avoid extra costs and time lose.
3.4.7 Microsoft office
Microsoft office package proved to be very useful in the documentation of the project steps and representation of work. Of particular interest are:
3.4.8 Excel spreadsheet:
Played a crucial role in the data analysis. It provides a user friendly platform to come up with tables, charts and graphs for the purposes of easy presentation and data comparison.
3.4.9 Microsoft word
All the documentation was compiled into or done by the use of Microsoft word. It made presentation of work more accessible and less confusing. Equations were also easily put up by the help of the software.
3.4.10 Microsoft Visio
Tables and flow diagrams presented in this project were done by the use of Microsoft Visio.
Microsoft PowerPoint:
For the purposes of doing power point presentation which includes the summarized project from the proposal stage, progress report and final capstone presentations Microsoft power point was employed.
3.4.11 Autodesk inventor
This software was applied in this project because of its multiple abilities to reduce and predict the functionality of the prototype before actual implementation. It was used extensively for coming up with possible solution drawings and working drawing. The nature of stresses acting on the tarmac surfaces and the pipes was also analysed using finite element analysis package of this inventor.
3.4.12 AFT Mercury
Applied flow technology (AFT) software tool was used in the sizing of pipes and ducting systems in order to reduce cost. It provided a spectacular betterment to the conventional design process, AFT Mercury was used for:
- Automatically sizing piping, ducting, pumps, valves and other components to achieve cost goals
- Provides a comprehensive approach to identify low cost design of real world systems that is rarely practical with traditional methods due to the large number of variables and constraints involved
- Provides the power of informed decision making when developing a low cost system design
3.4.13 AFT Fantom
AFT Fathom fluid mechanics simulation software was used to calculate pressure droppage and flow dispersion in liquid and ducting systems, its implementation helped in
- Evaluating heat transfer in pipes and heat exchangers
- Simulating System operation and component interaction
- Troubleshooting the designed system to determine the cause of functional failures.
- simulating individual system elements and their interaction
- integrating equipment features, output and analysis with system’s diagrammatic presentation
- Significantly adds to the quality of systems engineering that can be achieved, resulting in more efficient, less costly and more dependable piping systems
3.5 Conclusion
The chosen methods proved to provide a quiet good in depth understanding of the nature and focus of the project. Useful data was gathered efficiently and the engineering tools applied gave a well desirable outcome.
4 Results and discussion
4.1 Introduction
From the field research done a number of conclusions were drawn about the product’s feasibility and acceptance. Some weaknesses were noted and also platform to note areas where the product may need improvement was given to the people who were involved. The product was fully explained to the people approached before being interviewed or given questionnaires.
4.2 Questionnaire findings
4.2.1 End user perception
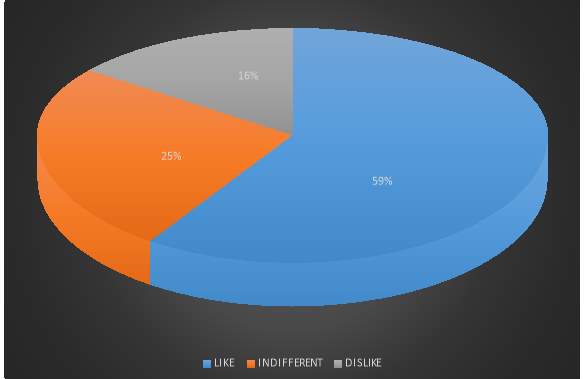
Figure 4:1: Pie chart showing the percentages of the people’s perception about the product
From the chart it can be seen that the majority of the people who managed to fill the questionnaire were either indifferent or had positive attitude towards the implementation of the product. However from the data gathered 90% of the people showed concern and some elements of doubt about the availability of water utilities. The country has been having serious shortages of water supply and this brought an element of mistrust in the end users who were approached.
4.2.2 Average hot water consumption per day
From the research conducted by form of questionnaires the results were extracted and tabulated in the bar graph below. The highest consumption was noted to be bathing followed by washing. The most need for hot water was around 6:00am to 7:00am and the reasonable cause of such a high demand would be preparation for work and school. Also demand would rise from 6:30pm to around 9:00pm during dish washing and after work bathing.
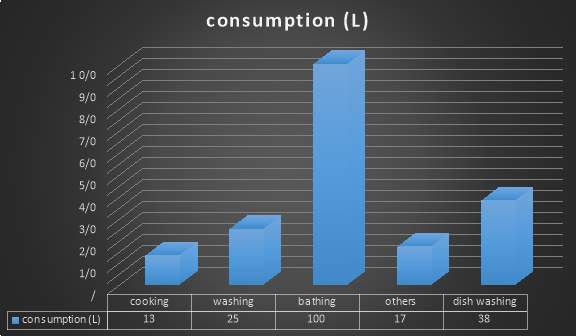
Figure 4:2 water usage chart
4.3 Experimental results
The results tabulated in this section have been obtained from the research and analysis done by other people and also the student did some tests and computer analysis to see how different parameters affect the performance of the proposed tarmac heat surface collector. It was found that the efficiency is affected by pipe diameter, pipe depth, pipe spacing, weather conditions and pipe length, the in-depth analysis of these factors are outlined below. Also of particular interest was the behaviour of the system due do external forces like traffic loading, the analysis was done to see how this affects the integrity of the system.
4.3.1 Comparison Of Different Material Properties
Table 4‑1 mechanical properties of different materials
| material |
Conductivity |
Strength |
| PVC |
|
|
| COPPER |
|
|
| ASBESTORS |
|
|
| IRON |
|
|
| |
|
|
4.3.2 Effect Of Changing Pipe Diameter
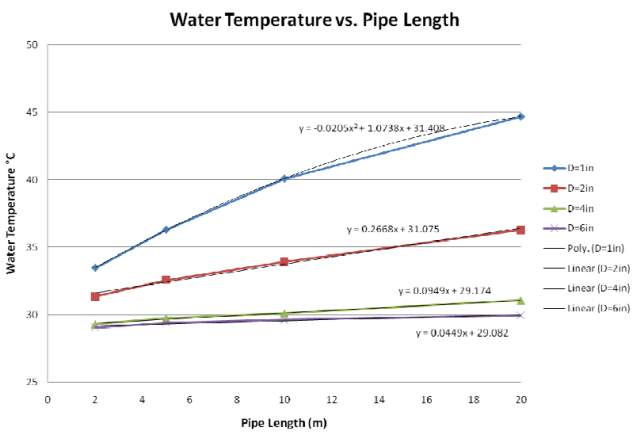
From the study carried out it was found that larger diameter of the pipes tends to increase the time required to gain heat. The graph in the figure below shows the quantitative effects of bigger pipe diameter. Varying the pipe diameter from 15mm to 75mm as shown the smallest diameter indicated the highest change in temperature increasing the diameter to 25m resulted in 50% droppage of heat energy. From this it can be deduced that larger pipe diameters provide high performances in reducing the surface temperature but results in low energy gain.
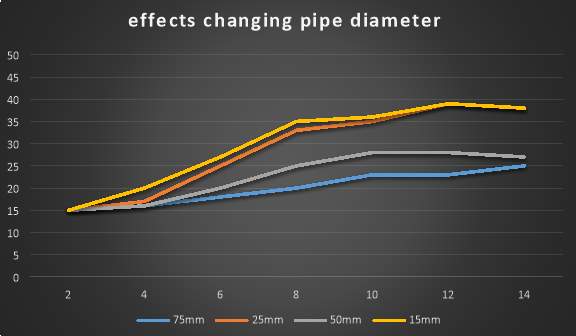
Figure 4:3 effects of changing pipe diameter
4.3.3 Effect Of Changing Pipe Spacing
The figure above shows the quantitative variation in the temperature with respect to pipe spacing. Of particular interest is the gradient of the curve with change in the spacing. Smaller gaps between pipes from 0 to about 0.6m have a steeper gradient. The figure below shows the results of a thermal analysis of pointing the variation of heat as shown in red, it can be deduced that larger spacing encourage higher temperatures to be achieved due to lack of heat absorbing matter which in this case is water, Though this may seem advantageous and likable there still needs to be struck a balance between wasting energy and gaining high temperatures.
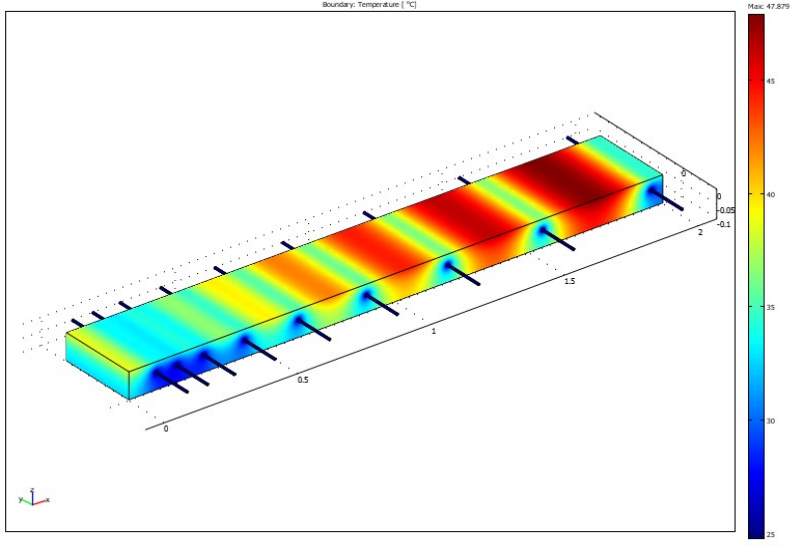
Figure 4:4 thermal analysis showing effects of pipe spacing
Towards the left end of the figure the big red gaps shows energy that is being wasted. In the middle the pipe spacing is 100mm and proved to have the same temperature as the spacing in the far right yet still more pipes can be put in the same area hence it was concluded that a spacing of 100mm is the most economic.
4.3.4 Effect Of Changing Fluid Velocity
The fluid velocity determines how much time the fluid will spend in the pipes hence the amount of energy that the water can gain. As shown below increasing the fluid velocity results in low energy gain. The effect was observed from varying the velocity from 0.1m/s to 2.0m/s and the effect was noted to be similar to that of changing pipe diameter. Significant increase in water temperature occurred between 0.1 and 0.5m/s. at velocities greater than 0.25m/s the system stops to be efficient.
4.3.5 Effect Of Changing Pipe Depth
Based on the figure below it was noted that reducing the depth from 755mm to 25mm increased the temperature gain by about 60%. Highest values of temperature are observable between 25 to 15mm. on both occasions the time required to attain the maximum possible temperature which in this case is 3 hours did not differ.
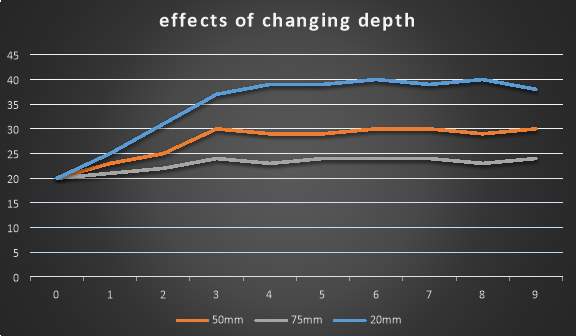
Figure 4:5 effects of altering pipe depth
4.3.6 Load Analysis
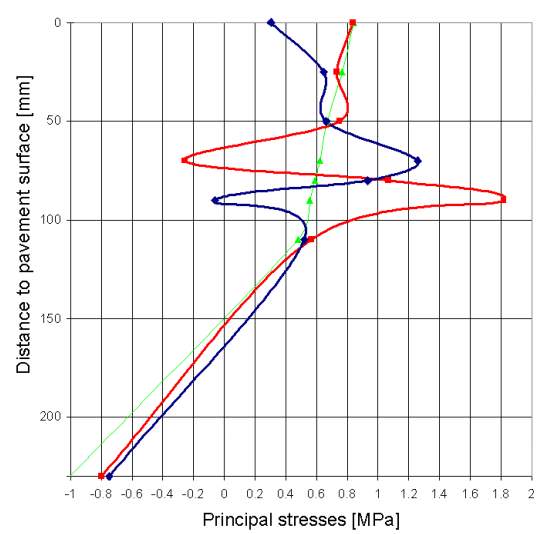
Figure 4:6 showing variation of principal stresses with depth obtained from innovation in the production and commercial use of energy extracted from asphalt pavements by C. Sullivan et al 2007.
Introducing pipes underneath tarmac pavement has got a tendency of reducing its strength hence may lead to a shorter life span of the road. This problem has been tackled by using comparatively soft tarmac mixture, which is capable of resisting cracks due to concentration of stresses. By first putting the 3D interlocking grid crack formation and growth is reduced. This softer mix may face the problem of permanent deformation due to high temperatures but the water in the tubes act as a condenser cooling the surface of the tarmac. With this at hand the system can be designed to withstand the expected loading.
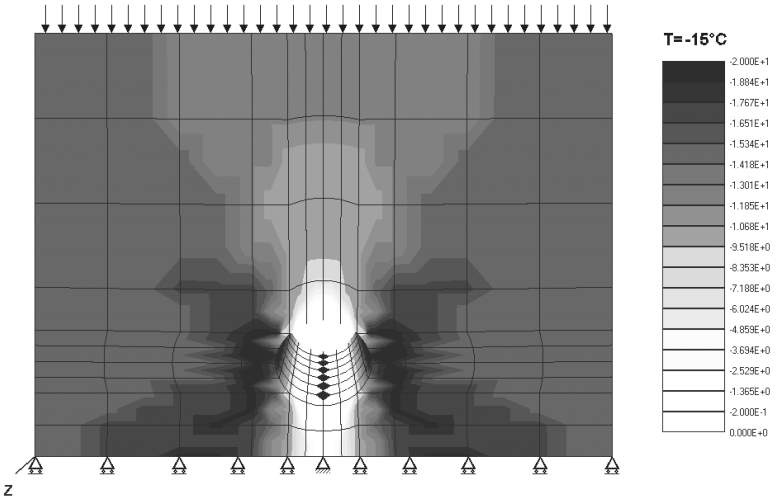
Figure 4:7 vertical stresses on the surface of tarmac
In the figure above graphical representation of stresses is shown. There is a development of a stress path diagonally protruding from the pipes to the sides of the specimen. It can be noted that there are low stresses below and above the tube, the pipe itself carries little load. Principal stresses were calculated from the shear and orthogonal stresses. It can be observed that principal stresses are 55% higher than average vertical stresses. At the highest temperature we observe highest stresses as shown by table 4-2 below.
4.3.7 Finite Element Result Analysis
Table 4‑2 showing results from FEA at different temperatures
