Yes, if you have worked with a writer before, you can request them again for consistency and familiarity with your needs. This ensures a smooth, tailored experience. Writer continuity helps maintain consistent style and understanding of your preferences. Browse profiles or contact support to make your choice. Essay writer relationships build over time for increasingly personalized academic support.
The opportunity arose to take part in The Introduction to SPSS tutorial, as this is a core POD within the research pillar of NGM I enrolled to take part. In addition, the ability to use this piece of statistical analysis software will be of benefit to me in completing other research POD’s, within my practicum and in my future career.
In preparation for the tutorial I conducted some research on SPSS. My research concluded that SPSS stands for Statistical Package for Social Sciences and it is a prominent statistical analysis software package, due to its easy to use graphical user interface (GUI). SPSS was first developed in 1968 by Norman Nie, Tex Hull and Dale Bent at Stanford University and it has been widely used in industry and university research (Sawilowsky, 2007). It is a Windows based program that facilitates data entry and analysis and can be used to create tables and graphs. It can handle large amounts of data and can perform a multitude of analyses (IBM Analytics, 2016). It is frequently used within the Social Sciences and in the business fields, therefore, understanding this program should serve me well in the future.
SPSS has the same general look a feel as most other Windows programmes, additionally, all procedures and functions are executed by a simple point-and-click. One must often navigate through the different layers of menu items before finding the required option.
The SPSS screen displays two viewing modes; a data entry screen where entered or imported data is displayed. The second view is variable view where the properties of the individual variables can be seen: including name, variable type, variable length, label etc. SPSS allows for the simply importation of excel files. It also includes a number of the fundamental windows properties such as cut, copy, paste, find – making it easy for new users to gain an understanding of the system, particularly if one has experience using MS Office tools.
An extensive range of data analysis functions can be performed using the tool, including hypothesis testing, frequencies, crosstabs, T-test, ANOVA, correlation, cluster analysis, factor analysis, discriminant analysis, missing value analysis and time series forecasting. As previously mentioned these functions are point and click automated, one can simply select the relevant variables, and SPSS will do the rest.
How Do You Ensure On-Time Delivery?
We assign writers immediately and monitor progress, with backup plans to guarantee your paper arrives on schedule. Your deadlines are our priority. Our project tracking system alerts us to potential delays for proactive intervention. Rest assured, we will deliver when you need it. My assignment help includes stringent deadline monitoring for reliable punctual delivery.
Whilst the tutorial provided a good overview of SPSS and its functionality, time restrictions limited our ability to cover some of the more intricate elements of the underlying principles and code. To further my learning and understanding I have chosen to research some of those elements as part of my reflection and to enable me to better use the software in practice.
2.1 Variables and Cases
Within statistical analysis data is a collection of different pieces of information or facts, called variables. A variable is an identifiable piece of data containing one or more values, they can take the form of a numbers or text (can be converted into number). For example, we could potentially have an age variable for each respondent or individual observation, these are cases – could be people, but could also be counties, organisations, countries, etc. Best practice states that variables should be contained in columns and observations in rows. In addition, the first row should be column headings and each dataset should contain at least one identifier (Torres-Reyna, 2011). 4
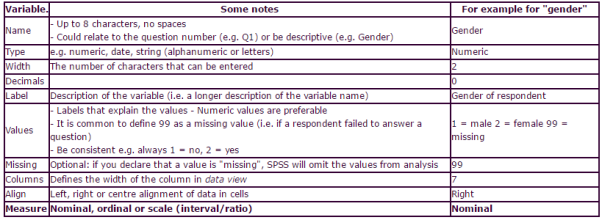
Table 1 Defining Variables (Source: Manchester Metropolitan University, 2008)
Can You Help with Reflective Essays?
Our writers craft thoughtful reflective essays, blending personal insight with academic structure to meet your goals. We capture your voice perfectly. Reflective writing requires balancing personal experience with scholarly analysis. Share your story or guidelines to get started. Research study bay professionals excel at combining personal narrative with academic rigor.
2.2 Values and Missing Values
Value labels are used to define the coding system for individual variables. Occasionally questions may be left unanswered – through carelessness, unwillingness to provide the desired information or an inability to answer the question on the part of the respondent. In addition, some questions may not be relevant to individual respondents. Within SPSS values that are specified as user-missing are flagged for special treatment and are excluded from most calculations (IBM Knowledge Centre, 2016).
2.3  Measure in SPSS

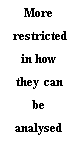
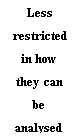
Figure 1Data Types (Source: Adapted from Garth, 2008)
What Is Your Quality Control Process?
Every paper is reviewed by editors for accuracy, style, and originality, ensuring it meets high academic standards. We use advanced tools to guarantee quality. Our multi-tiered review system includes both automated checks and expert human evaluation. Your paper will exceed expectations every time. Paper writing quality assurance involves multiple verification stages before delivery.
The last column needing to be defined is ‘Measure’. Here you must decide if a variable is Nominal, Ordinal or Scale.
A Nominal (sometimes also called categorical) variable is one whose values vary in categories. It is not possible to rank the categories created.
e.g. Gender varies in that an individual is either categorised as “male” or “female”.
An Ordinal variable is one where it is possible to rank the categories or put them in an order. The intervals between the categories used are not defined. e.g. preference by an individual could be ranked:
- dislike a lot
- dislike
- neither dislike or like
- like
- like a lot
Scale variables:
Can You Include Specific Sources?
Yes, provide your sources or let our writers find credible ones, properly cited to support your paper. Every source is cited perfectly. We integrate your required readings seamlessly while maintaining academic citation standards. Share your materials in the order form for best results. Assignment writer expertise ensures proper source integration and citation accuracy.
An Interval variable is one where the measurement scale uses the same interval between one measurement and the next (but the zero point is arbitrary).
e.g. Temperature is measured so that the interval between 19 degrees and 20 degrees is the same as the interval between 20 degrees and 21 degrees. The zero point on the Centigrade scale of measurement is arbitrarily set (freezing point of water) and does not mean there is “no temperature”.
A Ratio variable is the same as an interval variable but there is a true zero point. For example, height is a ratio variable, as a value of zero centimeters means there really is “no height” .