LIFE CYCLE ANALYSIS OF FISH PRODUCTS EMPHASIS ON FISH WASTE
The objectives of this research were to classify the wastes generated during the manufacturing processes of fish products and evaluate the environmental impacts of the fish wastes through life cycle analysis (LCA) as well as to characterize the potential utilization of fish wastes as protein-based thermoplastics. Production of canned fish products from Protigam Food Industries Sdn. Bhd. was investigated by following four steps in LCA; (1) goal and scope definition, (2) life cycle inventory (LCI) analysis, (3) life cycle impact assessment (LCIA) and (4) interpretation of result. The goal of this work is ‘cradle-to-grave’ life cycle of canned fish products whereas the scope is the functional unit of every 1 tonne of raw fish entering the factory. The LCI analysis was carried out by obtaining the inventory data of the whole process flow as well as the inputs and outputs of each subsystem in the manufacturing process. Then, LCIA was performed by identifying the related impact categories for the canned fish products, followed by calculation of the values for those related impact categories. The values were then normalized with the functional unit. It was shown that for every 1 tonne of raw fish entering the factory, about 0.22 tonnes of municipal solid waste was produced, 1.27 kg eq PO4 in eutrophication potential was increased and 1383.6 kWh of electricity was consumed. Lastly, the results were interpreted through contribution analysis where the process of butchering, icing and retorting were identified as the biggest contributor for impact categories of municipal solid wastes, eutrophication potential and energy consumption respectively. On the other hand, the result of Kjeldahl analysis showed that fish waste powder has about 16% protein content, making it a suitable candidate for protein based thermoplastics.
CHAPTER 1
INTRODUCTION
The production of fish products is increasing from year to year due to the high demand of global fish market. FAO (2016) reported that the growth of global fish supply is increasing at an annual rate of 3.2% from 1950 to 2014. In Malaysia, fish are generally processed into different forms such as frozen, cured and dried fish to meet the market demand (Huda, 2012). For example, the biggest percentage of fish products manufactured in Penang and Perak is processed fish products, including fish balls, fish crackers and fish cakes. However, the fish processing industry also contributes to the high consumption of electricity and generation of huge amount of wastes such as heads, guts and skins as well as wastes effluents (Henriksson, 2011). Hence, there is a need to evaluate the environmental impacts of fish processing industry in order to find solutions to improve the environmental performances of the industry.
In this work, Life Cycle Analysis (LCA) was chosen to be the environmental assessment tool. LCA is a quantitative method to assess the environmental performance throughout the entire life cycle of a product, process or activity in order to identify the best environmental option of waste treatment (Angelo et al., 2017). The LCA should include the entire product life cycle, material and energy acquisition, input material and energy during manufacturing, product outputs, generation of wastes, use of end products and waste management.
Wastes from fish processing industry are becoming the sources of pollution to the receiving environment where these wastes are discharged. According to Islam et al. (2004), the improper discharge of fish processing wastes had contributed to the huge increase in biological oxygen demand (BOD), chemical oxygen demand (COD), total suspended solids (TSS) and fat-oil-grease (FOG). The increase in these environmental parameters will lead to the low oxygen level in the water and contamination of water with foreign particles that can pose great threat to the aquatic animals and the people who use the polluted water.
There are several different waste management techniques used in different countries such as incineration, composting and pyrolysis. According to Ishak (2002), the waste management technique in Malaysia is end-of-pipe treatment. The end-of-pipe treatment is a traditional waste management approach which is applied after the processes to prevent the release of waste and by-products into the environment. There are a few disadvantages of this technique such as high cost of waste treatment as well as increases the environment burdens. Hence, there is a need for waste management technique applied in Malaysia to be updated so the new waste management technique can reduce the environment loads and lower the waste treatment cost.
One of the solutions for disposal of fish processing wastes is by utilizing the fish wastes in the productions of value-added products. Ghaly et al. (2013) reported the utilization of fish wastes in the production of fish silage, fish meal and fish sauces. The fish silage is produced from the liquefaction of fish tissues while the fish meal is prepared in powder form from fish filleting wastes. Besides, the fish sauce is produced from the salt fermentation of small pelagic fish by-products. Therefore, more research works on the utilizations of fish processing wastes should be carried out in order to identify more opportunities of income for the industry as well as to reduce the pollution.
The highlight of this project is to increase awareness and knowledge on the environmental impacts of fish wastes while the potential utilizations of fish wastes could aid in creating new industry sector which can leads to increase in job opportunities and new income for the nation.
Currently, fish processing industry generates huge amount of wastes that contributes to the increasing environmental pollutions. However, there are limited studies on the waste identification, management and impact assessment on the wastes from fish processing industry in Malaysia. This limitation has restricted the measurement of cleaner production technologies are seen as directly reducing environmentally harmful impacts during the production process. The end-of-pipe treatment technique which is normally implemented as a last stage of a process before the stream of air, water, waste, and product are disposed or delivered is seen as ineffective method if the demand in the fish products continue to rise in the future as the high cost of end-of-pipe treatment has encouraged the activities of illegal discarding of wastes.
- To evaluate the ‘cradle-to-grave’ life cycle of fish products through LCA.
- To identify classification of wastes produced during manufacturing processes of fish product.
- To evaluate the environmental impacts of fish processing wastes.
- To evaluate the protein content in fish waste to be used as a starting material for protein based thermoplastics.
This thesis basically consists of five chapters.
Chapter 1 provides the overview of the research and a brief literature survey of the previous and relevant work. The problem statement and the research objectives have also been stated and described in this chapter.
Any assignment type, any subject — expert help available now.
Case studies, lab reports, problem sets, reflective journals, group projects — our assignment specialists handle every format. We study your rubric and brief carefully, then deliver a distinction-level model answer you can learn from directly.
✓ Plagiarism-free · ✓ 100% human · ✓ Free revisions · ✓ Confidential
🔒 No payment to start · From 3 hrs
Chapter 2 highlights the detailed literature review of previous and relevant works about global fish consumption, production of fish products, fish processing industries in Penang and Perak, energy usage and processing wastes of fish processing industry, industrial waste, environmental impacts of fish wastes, life cycle analysis (LCA), current and potential utilizations of fish wastes as well as fish protein.
Chapter 3 presents the raw materials, methods and equipment used in the present work, which are Life Cycle Analysis (LCA) and Kjedahl Analysis. The procedures, characterization method and data collection techniques as well as data analysis methods have also been described in details.
Chapter 4 gives the interpretation and discussion of the experimental results of the research work. The results of LCA, including goal and scope definition, life cycle inventory (LCI), life cycle impact assessment (LCIA) and interpretation of result, waste treatment approach for fish product manufacturing as well as the characterization of composition of fish wastes have been discussed intensively in this chapter.
Chapter 5 presents the significance of the results and the summary of the research study. The recommendations for the future studies in the related research are included in this chapter.
CHAPTER 2
LITERATURE REVIEW
2.1 Global Fish Consumption and Production of Fish Products
Over the last 50 years, the production of seafood and fish products clearly reflected the global market demand. FAO (2016) reported that the growth in the global supply of fish products for human consumption has outpaced population growth by increasing at an average annual rate of 3.2 percent as shown in Figure 2.1. The statistic implies that the world seafood and fish products production will continue to rise in the future due to increasing demand of the global market.
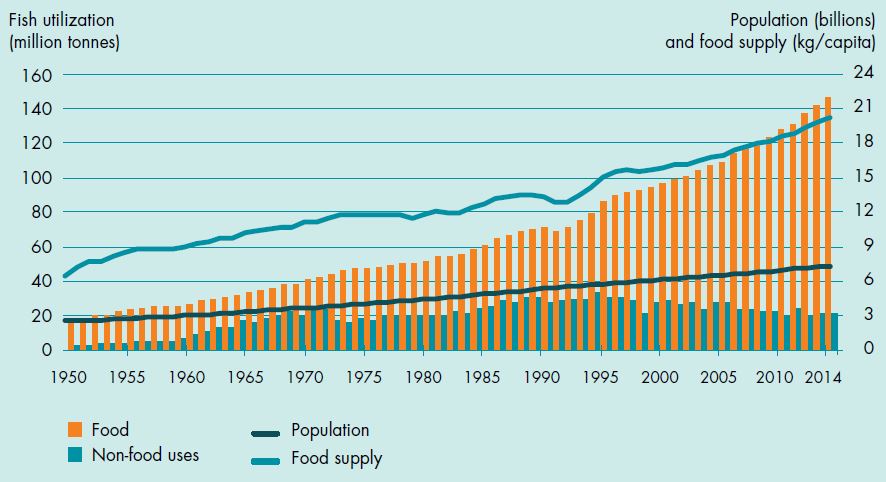
Figure 2.1: The plot of world fish utilization and supply (FAO, 2016).
FAOSTAT (2015) ranked Malaysia as the top seafood eating country in South East Asia with an average of annual per-capita consumption of 59 kg between 2000 and 2011. This indicates that for each Malaysian, the average annual fish consumption is 59 kg which is much higher as compared to that of world fish consumption per capita (21.4 kg). The statistics coincides with the increase in average monthly Malaysian household expenditures between 1993/94 (RM53.00) and 2009/2010 (RM98.00) (Tan et al. 2015). The data indicates that the rate of fish consumption in Malaysia increases with increase in income, the phenomenon will contributes to the increase in fish consumption rate per capita as the income of Malaysian is expected to increase in the future. Hence, the production of fish wastes is predicted to increase with increase in rate of fish consumption.
The huge market demand for fish products indirectly boost the growth of fish processing industry. According to the report of FAO (2016), only 67 million tonnes of fish for direct human consumption was in the form of live, fresh or chilled fish, representing 46% of the total amount of fish consumed by the world population in the year. The remaining 54% was processed in different forms such as cured fish (17 million tonnes), prepared and preserved fish (19 million tonnes) and frozen fish (44 million tonnes).
The trend in the world production of fish products is also reflected in the production of fish products in Malaysia. Huda (2012) reported that around 1,064,422 tons of marine fish that was landed in Peninsular Malaysia in the year of 2009, 63% of the landed marine fish are utilized for direct human consumption in the form of fresh fish while the rest are processed into different forms, which are fish meal (20%), cured (11%), frozen (1%) and disposal (5%). There are a few categories for cured fish, including salted, dried or smoked products (28%), fermented products (28%) and boiled or steamed products (5%) as well as other products like fish balls and fish crackers (39%).
The extensive growth in fish processing industry in Malaysia is observed in recent years. In 2014, there are huge amount of processed fish products was exported to other countries as well as imported into Malaysia (DOF, 2014). Figure 2.2 and Figure 2.3 illustrate the percentages of different exported and imported processed fisheries commodities in Year 2014 respectively. From Figure 2.2 and Figure 2.3, the fish products which are dried, salted or in brine but not smoked were identified as the most significant contributor of both exported and imported processed fisheries commodities with portions of 42% and 88% respectively. The phenomenon is probably due to the significant usage of these products in the daily meals of Malaysians.
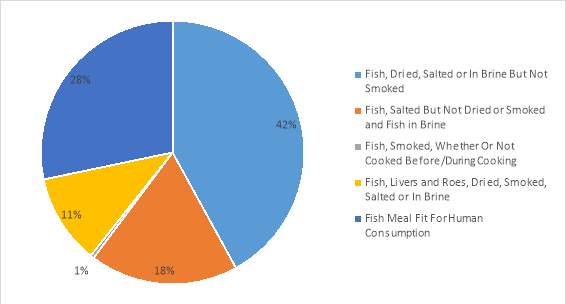
Figure 2.2: Percentages of different exported processed fisheries commodities in 2014 (DOF, 2014)
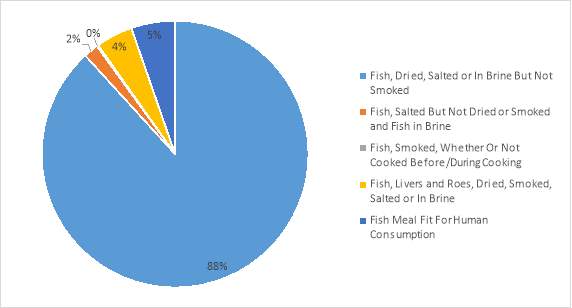
Figure 2.3: Percentages of different imported processed fisheries commodities in 2014 (DOF, 2014).
Any assignment type, any subject — expert help available now.
Case studies, lab reports, problem sets, reflective journals, group projects — our assignment specialists handle every format. We study your rubric and brief carefully, then deliver a distinction-level model answer you can learn from directly.
✓ Plagiarism-free · ✓ 100% human · ✓ Free revisions · ✓ Confidential
🔒 No payment to start · From 3 hrs
Fish consists of different components such as fins, backbone, fillet, head, skin, roe, gut and liver as shown in Figure 2.4. Usually, fillet is the major fish part consumed in human diet as fillet contains high nutritional values of protein content and omega 3 and 6 series lipids as well as few percent of saturated fat and cholesterol (Nova et al., 2005; River et al., 2016). Table 2.1 listed the average composition of fish.
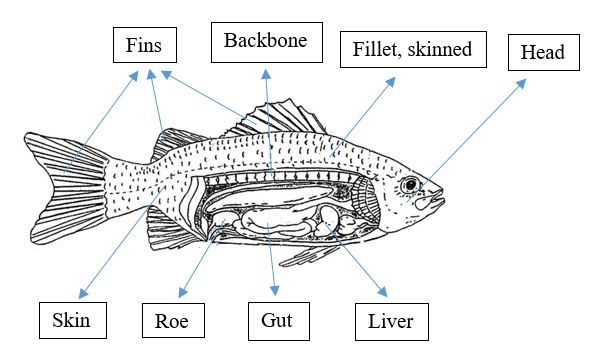
Figure 2.4: Various components of fish.
Table 2.1: Average composition of fish (Waterman, 2001).
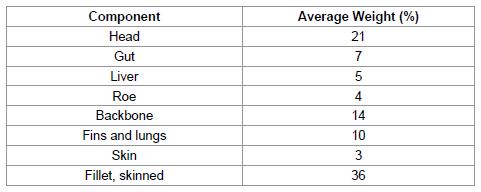
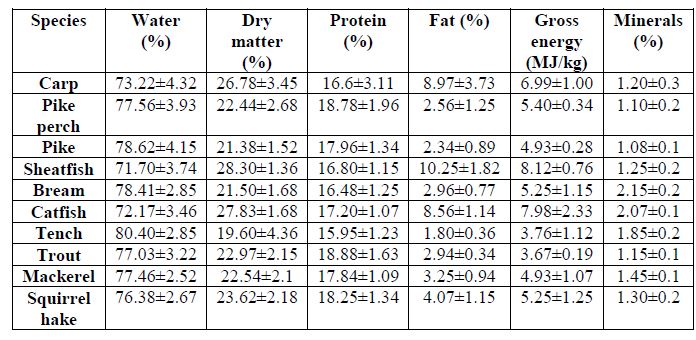
From Table 2.1, it was shown that the skinned fillet is found to be the most significant contributor for the weight of a fish. However, different fish species shows different properties. Bud et al. (2008) presented the composition of fish fillet for various fish species in Table 2.2. The main element of the composition of fish fillet is the water content as water content contributes more than 70% of the composition of fish fillet.
Table 2.2: Composition of fish fillet for various fish species (Bud et al. 2008).
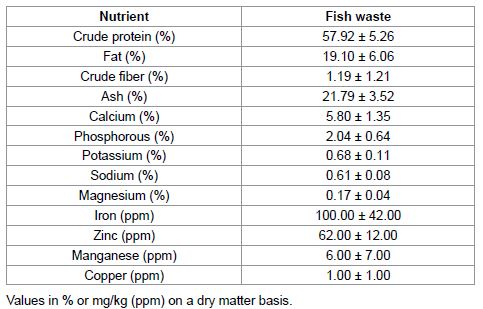
Other than fish fillet, all other non-edible fish parts are categorized as fish wastes. Esteban et al. (2007) listed the composition of fish waste as shown in Table 2.3. The crude protein is identified as the main component of fish waste as crude protein make up about 60% of the composition of fish waste.
Table 2.3: The composition of fish waste (Esteban et al., 2007)
However, the above composition of fish waste cannot be employed for all kinds of fish as each type of fish has its own specific chemical composition that produces wastes.
2.3 Fish Processing Industries in Penang and Perak
To narrow down the scope of research area focusing the nearby industry, fish processing industries in Penang and Perak were considered. In Penang and Perak, the fish are processed into different forms to maintain the quality of fish when the end products are delivered to the customers. The categories of fish products produced includes salted product, dried product, cooked product, frozen product, processed product and the other products. The percentages of fish processing industry manufacturers in Penang and Perak are illustrated in Figure 2.5 and Figure 2.6 respectively.
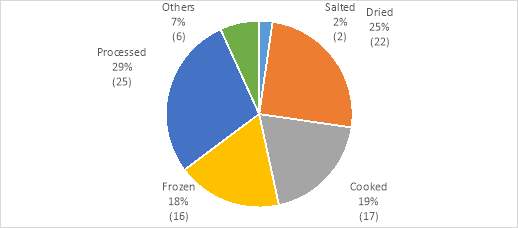
Figure 2.5: Percentages of fish processing industry manufacturers for different fish products in Penang, Malaysia (DOF, 2016).
Any assignment type, any subject — expert help available now.
Case studies, lab reports, problem sets, reflective journals, group projects — our assignment specialists handle every format. We study your rubric and brief carefully, then deliver a distinction-level model answer you can learn from directly.
✓ Plagiarism-free · ✓ 100% human · ✓ Free revisions · ✓ Confidential
🔒 No payment to start · From 3 hrs
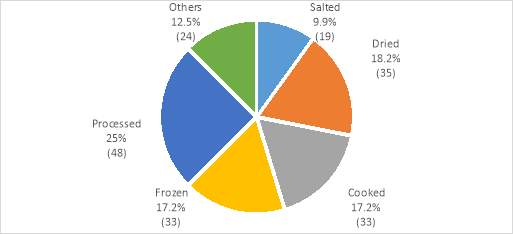
Figure 2.6: Percentages of fish processing industry manufacturers for different fish products in Perak, Malaysia (DOF, 2016).
Figure 2.5 and Figure 2.6 show that the biggest percentages of fish products manufacturers are processed fish products manufacturers. The processed fish products are generally composed of fish ball, fish cake, fish crackers and other processed food from fish which the end products are no longer in the form of fish. Other than processed fish products, dried fish products, cooked fish products and frozen fish products also contribute to the fish processing industries. The examples of cooked fish products are boiled fish and ‘Belacan’. This indicates that the multivariate of sectors of fish processing industry in Malaysia. So far, there is limited data on the waste produced from fish processing industries. However, by looking at the demand, it is not hard to imagine the great amount of fish wastes generated from the various sectors of fish processing industry in Penang and Perak.
2.4 Energy Usage and Wastes Generated from Fish Processing Industry
The fish processing industry contributes to the part of the energy consumption in fish industry. Figure 2.7 illustrates the basic production processes in the fish industry. Fishing phase is the phase which the activities of catching fish are carried out. From Figure 2.7, the fishing phase contributes to the largest part of energy consumption as it involves high consumption of fuel as fishing activities require the use of fishing boats and gears (Henriksson, 2011). Besides, about 25% of energy consumption in the fish industry is due to the transportation of fish products for marketing. Vans, lorries and other transportation vehicles are needed to transport the fish products to the markets such as wet markets, supermarkets and night markets and hence high rate of fuel consumption is involved. The processing of fish products only contributes about 10% of the total energy consumption in fish industry. The processing of fish products requires the use of machineries and motors where high electrical power is used. Although the energy consumption for the production of fish products is not significant compared to fishing phase and marketing phase, the portion is expected to be bigger in the future as the future processing will involve a very high production rate of fish products which will then involve higher consumption of electricity.
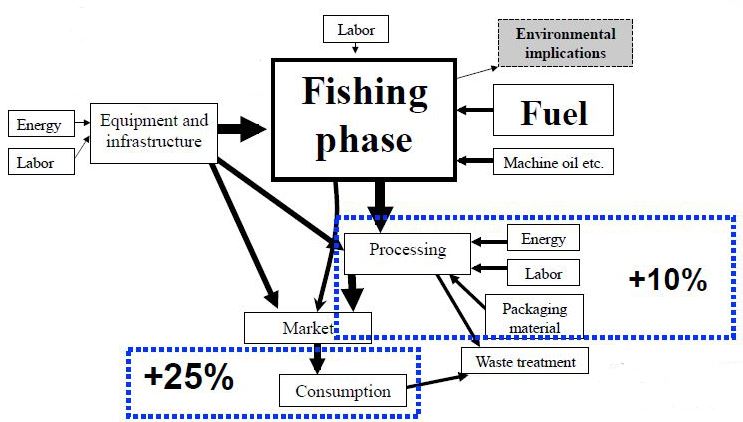
Figure 2.7: Flow chart of the production processes in fisheries with the energy consuming steps identified (Henriksson, 2011).
Ghaly et al. (2013) explained the steps of fish processing in the industry which involves stunning, grading, slime removal, deheading, washing, scaling, gutting, cutting of fins, meat bone separation and steaks as well as filleting. Processing of fish usually begins with the step of stunning. Stunning can provide sufficient movements to rupture the bones and blood vessel. The next step is grading where fish is sorted by species and size, followed by slime removal through continuous washing. The following step is scaling step which removes the scales from the fish to keep the fish fresh. After that, the fish will be washed to clean and remove the accumulated bacteria on the fish. Then, the inedible fish head and internal organs as well as fins will be removed during the consecutive deheading, gutting and fins cutting steps. Finally, filleting step will be carried out to get trimmed fillet and the meat will be removed from skin, scales and bones during process of meat bone separation. Figure 2.8 shows the typical sequence of fish processing steps in the fish processing industry.
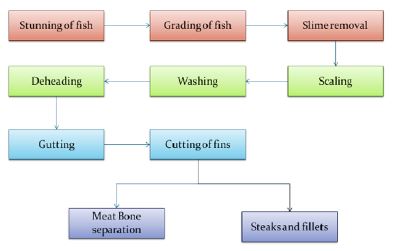
Figure 2.8: Fish processing steps (Ghaly et al., 2013).
During these steps, significant amount of wastes (20% – 80%) was generated depending upon the level of processing and type of fish. Ghaly et al. (2013) explained that there was an important amount of waste streams occurs mainly in the operations of scaling, deheading, gutting and fins cutting as well as meat bone separation. In these operations, solid fish wastes such as head, tails, skin, gut, fins and frames as well as the waste effluents (mainly water and oils) were generated. Okereke & Onunkwo (2014) described the processing steps of fish crackers in the fish processing industry. The deheading, gutting and deboning as well as washing process in the production of fish crackers were identified to be the main processes which generated wastes such as bones, guts and fins as well as huge volume of waste effluents. However, at present, the general research in energy consumption and processing wastes of fish products is still in its infancy. Further research study is necessary in order to recognize the main contributor of high energy consumption and generation of huge amount of fish processing wastes in the industry.
The wastes generated in the industries such as fish processing industries are generally categorised as industrial wastes. The specific meaning of industrial waste is that it is the unusable or rejected products or by-products of industrial processes. In Malaysia, the Department of Environment (DOE) has specified the definition of industrial waste. DOE characterized industrial waste as water from factories, processing effluents, slurry and sawdust (Ishak, 2002). Mohamed (2009) categorized the industrial wastes in Malaysia into two types which are solid wastes and hazardous wastes. In terms of industrial wastes, solid wastes include the solid, liquid, semi-solid or containerized gaseous wastes generated by industrial processes, activities or by-products which do not cause adverse effects to the human health and environment whereas hazardous wastes incorporate any substance endorsed to be scheduled wastes, or any matter either in solid, semi-solid, liquid, gas or vapour form which is released or emitted to the environment in such amount, volume or manner that can cause environmental pollution.
2.5.1 Current Industrial Waste Management Approach in Malaysia
Ishak (2002) reported that Malaysia is the one of the nations in South East Asia which has applied end-of-pipe treatment as main industrial waste management approach for a long time. The end-of-pipe technology is the traditional approach for industrial waste management, which is usually implemented as a last stage of a process to prevent the delivery and disposal of stream of wastes and by-products into the environment. Mohamed (2009) claimed that this end-of-pipe approach had generating numerous environmental issues such as illegal discarding of waste. The uncontrolled dumping of industrial wastes pose great threat to human health and environment. Table 2.4 listed the important incidents of illegal dumping of industrial waste in Malaysia.
Table 2.4: Reported Incidents of Hazardous Wastes Illegal Disposals in Malaysia (Mohamed, 2009).
Any assignment type, any subject — expert help available now.
Case studies, lab reports, problem sets, reflective journals, group projects — our assignment specialists handle every format. We study your rubric and brief carefully, then deliver a distinction-level model answer you can learn from directly.
✓ Plagiarism-free · ✓ 100% human · ✓ Free revisions · ✓ Confidential
🔒 No payment to start · From 3 hrs
| Year | Location | Amount and Type of Wastes | Company |
| 1989 | Pantai Remis, Perak | 1,500 tonnes of toxic wastes | Unknown |
| 1993 | Bukit Merah, Perak | Radioactive wastes | Asian Rare Earth Plant, Mitsubishi Kasei. |
| 1995 | Pangkor Island, Perak | Forty-one drums of highly |