ABSTRACT
With the rapid advancements in technology and increased competition between large corporations due to globalization, the importance of Business Intelligence as a tool to aid performance management is now at the forefront of business strategy. The aim of this project is to provide a proposal of a potential alternative Business Intelligence strategy and software to be adopted by GSKs Customs Duty Management department
The main focus of this study is a service within a large organisation, more specifically the Customs Duty Management service within GlaxoSmithKline. The service is a brand new one and is still in its infancy so as expected they haven’t fully adopted the culture of performance management and are not monitoring their Key Performance indicators in the most effective way.
This study looks at the need and importance of Performance Management using Key Performance indicators and what benefits are derived from embedding performance management within a service. In order to do this, a picture of the services current practice will be built, this will be done by using a variety of methods including observation and evaluation of the current ways of working by utilising Process Mapping for illustration, surveys and interviews will also be utilized in order to gauge the users attitudes towards the existing method of performance management. An evaluation of the current Business Intelligence maturity level of the department shall be conducted and proposals to improve the current level of BI maturity shall be put forward along with a comparison of possible software alternatives to the existing method.
Key Words: Key Performance Indicators, Performance Management, Business Intelligence
ACKNOWLEDGEMENTS
TABLE OF CONTENTS
1.2.1 Problems with Current Practices
1.2.2 How is the Department Affected?
2.1 Performance Measurement & Management
2.2 Key Performance Indicators (KPIs)
2.2.2 Uses of KPI metrics within organisations
2.2.4 Key Performance Management for Performance Management
2.2.5 Key Performance Indicators for Business Intelligence
3.5 Positivist vs Interpretivist Paradigms
AI-generated draft flagged? We make it genuinely human.
Our writers rewrite AI-generated content so it reads with authentic voice, proper academic nuance, and zero AI detection flags. The result passes Turnitin, GPTZero, and your professor's scrutiny — while keeping your original ideas intact.
✓ Plagiarism-free · ✓ 100% human · ✓ Free revisions · ✓ Confidential
🔒 No payment to start · From 3 hrs
3.13 Semi-Structured Interview
3.14 Business Process Modelling
4.2.1 Classification Process SIPOC
4.2.2 Classification Process Output
4.3 Customs Authority Request (CAR) GEMBA
4.3.1 Customs Authority Request SIPOC
4.3.2 Customs Access Request Output
4.4 Preferential Origin (PO) GEMBA
4.4.1 Preferential Origin SIPOC
4.4.2 Preferential Origin Output
4.5 Duty Optimization & Special Regimes GEMBA – FOR REVIEW BY KD
4.5.1 Duty Optimization & Special Regimes (DOSR) SIPOC
4.5.2 Duty Optimization & Special Regimes (DOSR) Output
4.7 Results of the interview process
4.7.1 Interview Procedure & Justification
APPENDICIES
ABBREVIATIONS
LIST OF FIGURES
Figure 1: Relationship between Performance Management & Performance Measurement (Lebas, 1995)
Figure 2: Business Goals, KPIs & Micro-Transactions (RocketMill.co.uk, 2015)
Figure 3: Strategic alignment with KPIs (Bauer, 2004)
Figure 4: A basic understanding of BI (Ranjan, 2009)
AI-generated draft flagged? We make it genuinely human.
Our writers rewrite AI-generated content so it reads with authentic voice, proper academic nuance, and zero AI detection flags. The result passes Turnitin, GPTZero, and your professor's scrutiny — while keeping your original ideas intact.
✓ Plagiarism-free · ✓ 100% human · ✓ Free revisions · ✓ Confidential
🔒 No payment to start · From 3 hrs
Figure 5: Different Stages of Service Maturity (Little, 2009)
Figure 6: Approach to defining the Research Methodology (Tuli, 2011)
Figure 7: Comparison between Quantitative & Qualitative research (Greener, 2008)
Figure 8: Likert Scale in KPI Questionnaire, 2017
Figure 9: KPI Questionnaire, 2017
Figure 10: Amount of Control the Interviewer Has Over the Interview (Harrell & Bradley, 2009)
Figure 11: Illustration of a Business Process (Lampathaki, et al., 2013)
Figure 12: Benefits of BPM within an Organisation (Alzubidi, et al., 2011)
Figure 13: SIPOC Diagram Illustration (Tasko Consulting, 2017)
Figure 14: Classification SIPOC
Figure 15: Classification Metrics
Figure 16: Customs Access Request SIPOC
Figure 17: Open CARs by country of origin
Figure 18: Open CARs by Year Opened
Figure 19: Preferential Origin SIPOC
Figure 20: Preferential Origin Metrics
Figure 21: Duty Optimisation & Special Regimes SIPOC
Figure 22: Duty Optimisation & Special Regimes Metrics
Figure 23: The Respondents Service Line
Figure 24: Time Spent Compiling Metrics
Figure 25: Likert Scale responses
Figure 26: Question 3 Response percentages
Figure 27: Question 4 Response percentages
Figure 28: Question 5 Response percentages
Figure 29: Question 6 Response percentages
Figure 30: Question 7 Response percentages
Figure 31: Question 8 Response percentages
Figure 32: Question 9 Response percentages
Figure 33: Question 9 Response percentages
Figure 34: Question 11 Responses
Figure 35: Question 12 Responses
LIST OF TABLES
Table 2: Functions served by having KPI metrics (Melnyk, et al., 2004)
Table 3: Aims of Conducting the Research
Table 4: Classification Service Process Information
Table 5: Customs Authority Request Process Information
AI-generated draft flagged? We make it genuinely human.
Our writers rewrite AI-generated content so it reads with authentic voice, proper academic nuance, and zero AI detection flags. The result passes Turnitin, GPTZero, and your professor's scrutiny — while keeping your original ideas intact.
✓ Plagiarism-free · ✓ 100% human · ✓ Free revisions · ✓ Confidential
🔒 No payment to start · From 3 hrs
Table 6: Preferential Origin Process Information
Table 7: Duty Optimization & Special Regimes KPI Information
Table 8: Interview Questions Rationale
Table 9: Response to Question 2
Table 10: Response to Question 3
Table 11: Response to Question 4
Table 12: Response to Question 5
Table 13: Response to Question 6
Table 14: Response to Question 7
Table 15: Response to Question 8
Table 16: Response to Question 9
Table 17: Response to Question 10
CHAPTER 1: INTRODUCTION
1.0 CHAPTER OVERVIEW
This chapter introduces the company and department that are central to this project; it presents the reader with a bit of background about the company and department that the project is about, along with the motivation behind the project. The current Performance Management process is introduced along with a summary of the problems with the current process and how said problems are affecting the department. Following on from that the researcher will set out the project the aims and objectives before setting out the structure of the study.
1.1 Company Background
GlaxoSmithKline (GSK) is one of the world’s largest research-based pharmaceutical organisations that discovers, develops, manufactures and markets branded human health products. The beginning of this incredible organisation began in 2000 when Glaxo Wellcome and SmithKline Beecham formed through a merger after a series of acquisitions of other pharmaceutical and scientific organisationsInvalid source specified..
Within GSK there are a number of different departments, the one that is central to this project is a brand new service called Customs Duty Management. The Customs Duty Management department is responsible for ensuring GSKs customs duty compliance globally. Within the Customs Duty Management department there are 4 main services, they are:
- Preferential Origin (PO)
- Classification
- Customs Authority Request (CAR)
- Duty Optimisation & Special Regimes (DOSR)
1.2 Current Ways of Working
With the Customs Duty Management department still being a relatively new and immature service, it was to be expected that new ways of working would need to be introduced. The issue that forms the basis of this project was the lack of a standard process for the compilation of the departments Key Performance Indicator (KPI) metrics as each different service within the department has adopted a different process for the compilation of their own services KPI metrics. In addition to this system that is used to compile the metrics often involve very time consuming & complicated process and inefficient process which involves manually capturing, analysing large amounts of data to be exported onto a spreadsheet document before being manually transformed visual dashboards to be used in the monthly departmental performance management meetings. The problems with the current Performance Management process are summarized below:
1.2.1 Problems with Current Practices
- There is not a standardized method of compiling the Performance Management metrics throughout the department as the, different services within Customs Duty Management using different processes compile their service metrics.
- The performance management process is very inefficient in terms of time taken to compile the metrics.
- The manual nature of the extraction and manipulation data to from multiple sources in order compile the metric current process makes the compilation process prone to human errors occurring.
- There is a lack of accountability for the compilation of the service metric, the compilation of the Performance Management metrics is done in silos meaning each service is responsible for compiling and presenting their individual service metrics.
- The department utilizes spreadsheet software to collate the raw data collected in a single location in order for it be manually manipulated and transformed into visual dashboards. The decision to manually manipulate the data using spreadsheet software effectively simulating the functionality Business Intelligence is also questionable.
1.2.2 How is the Department Affected?
- The lack of standardization makes the Performance Management process inefficient as the different departments are effectively taking different routes to the same end goal.
- The amount of time taken to manually capture and sort the data from the various sources, as well as having to manually compile visual dashboards, could be used to tend to more business critical tasks.
- The manual nature and highly labour intensive nature of the Performance Management process makes it prone to human error.
- The non-accountability when it comes to the compilation of the departmental metrics puts strain on the service leads ability to compile the metrics on a weekly basis, in the event they are unable to compile the metrics, there isn’t anyone else within the service with the knowledge to be able to compile the metrics.
- The dashboards & reports created using spreadsheet software is only as good as the data used to create them, if the data used to create the dashboards is inaccurate; the metrics produced will be of low quality and therefore will not provide much business value.
1.3 Project Aims & Objectives
The main objective of the project is to provide a proposal of a potential alternative Business Intelligence strategy and software to be adopted by GSKs Customs Duty Management department. In order to achieve the main objective set out, the researcher aims to:
- Conduct research into the importance of performance management within organizations and the business value that it provides.
- Utilize data collection techniques and process mapping tools to illustrate the current Business Intelligence system that is currently being used by Customs Duty Management to compile the departmental Performance Management metrics. This is done in order to gain a better understanding of the current process.
- Carry out an in depth analysis of the data gathered along with a detailed evaluation of the current Business Intelligence system used to compile the departmental in order to determine the suitability of the current Business Intelligence strategy being adopted by Customs Duty Management in order to Compile their Performance Management Metrics.
- Establish the current Business Intelligence maturity level of the Customs Duty Management department.
- Establish how the current level of Business Intelligence maturity can be increased whilst also solving the issued with the current Business Intelligence system that is in Place.
- Provide a comparison of potential Business Intelligence software solutions that the department can implement to replace the current Business Intelligence system in place.
1.4 Structure of Study
The structure of the entire study is as follows. A literature review is presented to provide an introduction to Performance management and Key Performance indicators and their importance in business decision making and overall organizational performance. The next chapter is an exploration of the research methodology used in this report; this contains the appropriateness and justification of the research and data collection methods and tools that the researcher utilized. The next chapter displays the results of the data collection process that occurred as a result of the utilization of the methods discussed in the methodology chapter. The penultimate section presents an in depth discussion of the results collated in the results chapter, the results are interpreted, backed up with literature and the implications to Customs Duty Management department are explored. Finally the researcher makes a case for the adoption of a Business Intelligence software solution that will replace that which is currently being utilized by Customs Duty Management with the aim of increasing the Business Intelligence maturity of the department and realizing the potential value derived from an effective Performance Management process & Business Intelligence strategy.
1.5 CHAPTER SUMMARY
In this chapter the company that is central to this project has been introduced, the current performance management process being currently adopted along with the issues and consequences they faced were also explored. The motivation for the project and the identification of the project aims and objectives were also defined before finally setting out the structure of the study to be carried out. At this point, the reader should be familiar with: who the end user is, the reasoning behind the project and what the researcher aims to achieve by undertaking this project.
CHAPTER 2: LITERATURE REVIEW
2.0 CHAPTER OVERVIEW
By the end of this chapter, the researcher aims to introduce relevant literature and background knowledge on the main concepts that are related to this report which includes:
- The theories of performance management and performance measurement and the difference between the two concepts.
- Key Performance Indicators (KPIs), their characteristics and the benefits their utilization brings to an organization.
- The concept of Business Intelligence (BI) as well as an exploration into the relationship between BI and KPIs.
- Services and service maturity will be defined along with the different stages of service maturity model.
The successful completion of this chapter will satisfy objective 1 set out in section 1.3 of this report
2.1 Performance Measurement & Management
The term performance is defined in the Business Dictionary (2017) as being the “accomplishment of a given task measured against standards of accuracy, completeness, cost and speed”, hence performance can be said to be the ability to complete a given task whilst also meeting a pre-determined criteria set to measure how well the task has been carried out. The concept of performance is a subjective one meaning that its meaning depends on the context for which it is being used, the definition of performance in a sporting context will greatly differ its meaning in an organizational context. Taking that into consideration, the general principle of being able to complete a task to a pre-determined standard can be applied in all instances of the word.
This report looks at the concept of performance from an organizational lens. Gaining insight into the level of business performance being achieved by the company has long been an area of interest for managers and management of organizations (Otley, 1999) but for many years, financial measures have been seen as the main method of organisational performance measurement. Due to the increase in the number of factors that now have an effect on organizational performance in terms of the complexity of organisations and the markets in which they operate, corporations soon realised that the sole utilization of financial measures as the criteria for assessing business success was not feasible (Kennerley & Neely, 2002) hence the traditional paradigm of utilizing financial performance as a means of measuring business success was judged to be flawed as it failed to look past profit as being the overriding goal.
In order to move away from the traditional model of measuring business success, the concepts of performance measurement and performance management were. Although used interchangeably, the two terms are different, Verweire & Van Den Berghe (2004) viewed performance management as being the process of measuring and reporting on how well the organization is performing by qualifying how efficiently and effectively an organization deliver its goods or services, Amaratunga & Baldry (2002) expands on this view by saying that performance measurement is seen as a basis for an organisation to assess how well they are performing when compared to predetermined objectives. With that in mind the role that performance measurement has to play in the enhancement of business performance cannot be understated, Waggoner, et al. (1999) supports this by stating that effective performance measurement plays an important role in focusing people and resources on particular aspects of the business with the aim of enhancing the overall business performance.
Having the data that shows the effectively and efficiently a business delivers its goods or services is all well and good, but the real business value of performance measurement comes through harnessing the data captured and utilizing it as a key decision making tool to drive business strategy. With that said, Performance Measurement can be seen as a tool to aid Performance management. Performance management is viewed as the utilization of Performance Measurement information to effect positive organizational change (Amaratunga & Baldry, 2002), performance management is said to precede and follow performance measurement (Fig 1) in the sense that the information that is derived from the performance management process provides the context for performance measurement. (Lebas, 1995). In essence, Performance Management aims to use the data collated to make strategic organizational decisions, hence contributing to the increase in organizational performance (Neely, 2007)
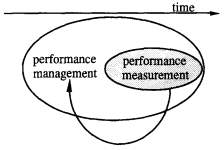
Figure 1: Relationship between Performance Management & Performance Measurement (Lebas, 1995)
2.2 Key Performance Indicators (KPIs)
2.2.1 What is a KPI?
Key Performance Indicators (KPIs) are defined as quantifiable measures which aim to reflect the performance of a business in comparison to its pre-defined goals and objectives (Bauer, 2004) Parmenter adds to this view by stating his view of KPIs as being asset of measures that focus on a particular aspect of an organization that the organization sees as its most critical (Parmenter, 2015). Although KPIs and metrics are often used interchangeably, it is important to differentiate the two as they are not the same. Metrics are defined by Melnyk, et al (2004) as being verifiable quantitative or qualitative measures which exist as tools for decision making, with KPIs already defined above, it is worth noting that KPIs are metrics, but the defining feature that differentiates of a KPI from a metric is that a KPI is linked to a strategic objective/goal (Eckerson, 2009). So it can be concluded that a KPI is a type of metric, but not all metrics are KPIs, the words ‘KPI’, ‘KPI Metrics’ & ‘Performance Management metrics’ will be used interchangeably throughout this paper, in order to avoid confusion it is worth noting that they all refer to the same concept.
In order to gain a better insight into the meaning of KPIs, Segen (2011) breaks the word “Key Performance Indicators” down further:
- Key: The word ‘KEY’ indicates that it is of fundamental importance in achieving business objectives and creating competitive advantage.
- Relating to Performance: This means that it can be quantified, measured and easily influenced by the organisation.
- An Indicator: Indicators provide information on current/future performance
Parameter (2015) builds on the point above made by Eckerson by pointing to KPI being the only thing that links the day to day business performance (Micro-transactions) with the critical success factors of the organisations (Business Goals) the business goals (Fig 2), the link between the Business objectives and businesses micro-transactions in the form of KPIs forms an integral part of business performance management as it enables the business/service to measure their day to day performance against their critical success factors, having a quantifiable measure of business performance facilitates data backed decision making as the data provides information to the management that enables them to see if the business goals & objectives are being met or not (Rodriguez, et al., 2009). With that in mind it is very important to note that KPIs only provide Quantitative data, that on its own is not enough to inform decision making, it is therefore down to management to decide how to interpret that data and turn it into information needed to aid strategic decision making.
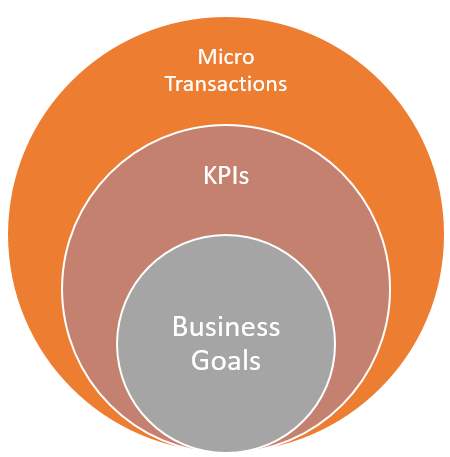
Figure 2: Business Goals, KPIs & Micro-Transactions (RocketMill.co.uk, 2015)
In order to gain a better understanding of how KPIs are linked to business goals and micro-transactions, an example of the KPIs used by a service provider is used (Table 1). A business goal for the service provider could be to increase customer satisfaction in the provision of the service, in order to measure customer satisfaction the KPI for the service provider could be the amount of complaints received from the customers over a period of time. The Micro-Transactions could be the level of customer service offered to the customer. If the amount of complaints received exceeds the pre-defined amount set as the KPI, this is flagged as a cause for concern as the service provider is not meeting the pre-determined level of customer service that is expected. As an action the company could then resort to increasing the amount of customer service training carried out within the company in order to improve the performance in relation to the KPI
| Business Goal | Key Performance Indicator | Micro Transaction | Below KPI Decision |
| Increase Customer Satisfaction | Amount of customer complaint received | Level of customer service provided by the employees | Increase the amount of employee training on customer service |
Table 1: Example of how KPIs links Business Goals & Micro Transactions in order to facilitate decision making
AI-generated draft flagged? We make it genuinely human.
Our writers rewrite AI-generated content so it reads with authentic voice, proper academic nuance, and zero AI detection flags. The result passes Turnitin, GPTZero, and your professor's scrutiny — while keeping your original ideas intact.
✓ Plagiarism-free · ✓ 100% human · ✓ Free revisions · ✓ Confidential
🔒 No payment to start · From 3 hrs
2.2.2 Uses of KPI metrics within organisations
| Function | Benefit |
| Control |