An exploration of techniques used in Data Analytics to produce analysed data in graphical format.
4.2 A brief history of Big Data
4.5 Data terms used in Data Analytics
3. Clustering/Cluster analysis
4.6 Relationship between Big Data and Data Analytics
4.7.1 Datasets – File Extensive
4.8 Techniques use in Data Analytics/Data Science
4.9.1 Programming Languages used in Data Analytics
4.9.2 R – Programming Language:
4.9.3 Python – Programming Language:
4.9.4 Comparing the Languages:
5.1 Overview of the project software requirements
5.2 Functional Requirements Diagram:
5.2 Non – Functional Requirements
5.3 Non – Functional Requirements
6.1 Diagrams illustrating the Overview of the project:
6.2 Overview of Data flow diagram:
7.2.A Data – Streaming the data:
7.3.1 Cleaning the preparing the Food Balance Dataset:
Importing the datasets – Food Balance
Cleaning and preparing – Food Balance
7.4.1 – Food Balance dataset – Analysing and Extracting of the Data:
7.5.1- Food Balance dataset -Visualization of the results
7.2.B Data – 2. Diabetes prevalence (% of population ages 20 to 79):
🌎
International student? We write to your exact standard.
Harvard referencing for UK unis, APA 7th for US colleges, Vancouver for nursing — our geo-specialist writers know precisely what your professors expect. 3-hour deadlines. 100% original. Fully confidential.
✓ Plagiarism-free · ✓ 100% human-written · ✓ Free revisions · ✓ Confidential
🔒 No payment to start · From $11/page
Description -2. Diabetes prevalence
7.3. 2 Importing the datasets – Diabetes prevalence
Cleaning and preparing – Diabetes prevalence
8.1.A Data – Streaming the data:
8.1.B.1 Data – Food balance – Ireland output – A
8.1.B.3 Data – Food balance – U.K output
8.1.B.4 Data – Food balance – Comparing U.K and Ireland
8.1.B.5 Diabetes for population ages 20 to 79
9.1 Result of the requirements (functional and non-functional):
9.1.A Data – Streaming the data:
9.1.B Data – Diabetes for population ages 20 to 79:
Demonstrate on how to install the relevant package
Appendix -Section 2- Python scripts used to stream data
A. Python Scripts used to stream sugar tweets:
B. File located in containing the relevant tweets:
D. Append script to show split tweets only:
E. Output of spilt tweets in Notepad:
F. Script used to produce chart:
Appendix-Section 3 – Cleaning and preparing the data
A. Script used to apply the describe command and the results from the command:
B. Python scripts used to produce charts before cleaning and preparing the data:
Box plots using random numbers:
C. Python Code – cleaning and preparing the data
Appendix -Section 4 -second dataset -world rise in diabetes:
Appendix -Section 5 – Scikit-Learn – Demo File
5.4 Result of the comparing cluster:
Figures:
Figure 1-Health Ireland Survey 2015 -(Damian.Loscher,2015)
Figure 2- Simple steps to illustrate Big Data (Li,2015)
Figure 3- Process of Big Data (Gandomi and Haider,2015)
Figure 4-Diagram of functional requirements
Figure 5-Functional requirements
Figure 6-Diagram of Functional Requirements
Figure 7-Non- functional requirements
Figure 8-Diagram of non-functional requirements
Figure 10- Outlined of the project process
Figure 11-Overview of Data-flow diagram
Figure 12-Steps of Data-flow diagram
Figure 14- Outlined details of the Implementation stages
Figure 15- Download the Enthought Canopy
Figure 16-Create a new Twitter account.
Figure 17-Shows the create a twitter app
Figure 19- Overview of the file in notepad.
Figure 20- This shows the number of rows and columns
Figure 21-Importing the Food Balance file into Enthought Canopy.
Figure 22-Shows the result after the dataset was cleaned.
Figure 24-Create a Plotly account
Figure 25-Imported csv file in Enthought Canopy
Figure 26- Result of the Python scripts
Figure 27- Output of Ireland result
Figure 28-3D output of Ireland result
🔍
Already written your paper? Make it submission-ready.
Our professional editors fix grammar, argument flow, structure, and referencing errors that spell-checkers miss. Choose light proofreading or full structural editing — returned within 12–24 hours.
✓ Plagiarism-free · ✓ 100% human-written · ✓ Free revisions · ✓ Confidential
🔒 No payment to start · From $11/page
Figure 30-Comparing both countries
Figure 33- Functional requirement
Figure 34- Result of non-functional
Figure 35-Displaying the Apparatus
Figure 36-download the package tweepy into Enthought Canopy
Figure 37- first script to stream data
Figure 38- The file which contains the tweets
Figure 39- Output tweets in a notepad
Figure 40- This code spilt the tweet
Figure 41- The output of the split code
Figure 42- Scripts to produce the chart
Figure 43- Command for describe
Figure 45-Python script creating charts
Figure 46-Bootstrap Chart before clean
Figure 47- Box plot before clean
Figure 49- Scatter plot before clean
Figure 50- Line chart before clean
Figure 51- Command to get the max
Figure 57- Show the data types
Figure 58-Prints out the types result
Figure 60- Result of the deleted columns
Figure 62- Result of the figure 59
Figure 65- Alternation of the file
Figure 67- Number of rows and columns
Figure 69- Output the diabetes
Figure 70- File import to canopy
Figure 73- Box chart before clean
Figure 74- Chart to show diabetes
Figure 76- Print out the dataframe
Figure 78- Removes the columns
Figure 79- Result the of figure 76
Figure 80- The rows and columns
Figure 83- Show the false in the result
Figure 91- Chart of the general file
Figure 92- Example of Clustering
Figure 93- Result of Clustering
1. Project Proposal
Data Analytics – An exploration of techniques used in Data Analytics to produce analysed data in graphical format.
1. 1 Introduction
This project, will examine the techniques of Data Analytics used to cleanse, analyse, extract data and produce visual charts.
This project should demonstrate that Python language, can be used as a main element in the process of Data Analytics.
1.2 Background
Data Analytics, is the term given to the overall process, that collects, analysing, uses machine learning to developing algorithms which can produce predictable data via technology (Waller and Fawcett, 2013). Data Science has become an essential factor of the industry due to the massive impact of Internet. This is mainly due to the rapid advancements in technology and software, which allows people to gain a working knowledge of Data Science. However, Data Science requires the user to know what information they may need before the process begins.
This project, will achieve the process of Data Analytics, by obtaining datasets, streaming data, using Python scripts to cleanse and prepare the data to visually display the predicted results, in graphical form. This project will generate data on how sugar has become a major vocal point of discussion in our life’s. Data will be collected to demonstrate, how the amount of raw sugar imported to Ireland and the U.K has increased.
In recent times, the rise in sugar consumption has become a concern, since sugar is not only contained within fruit and vegetables, it is also added to various types of other foods such as cereals, processed foods, and drinks (Waller and Fawcett, 2013).
Increased sugar consumption can have an influence on body weight which can lead to such illnesses as heart disease, diabetes, metabolic syndrome, kidney disease (Johnson et al., 2007).
In Ireland, a proposed tax of 10% on SSB (sugar sweetened beverages) was addressed due to the rise in child-hood obesity in 2011 (Scarborough et al., 2013). This year in the budget it was confirm that in April 2018 the SSB tax will be added to all sugar products (Pope, 2016).
✅
Complex assessment task? We know what markers reward.
Our assessment specialists decode your marking rubric and deliver model answers targeting distinction criteria — written, practical, and portfolio assessments at US, UK, Australian, and Canadian universities.
✓ Plagiarism-free · ✓ 100% human-written · ✓ Free revisions · ✓ Confidential
🔒 No payment to start · From $11/page
A report was produced in 2015 called “Healthy Ireland Survey 2015” and this report was based on comparing sugar intake to snack intake in Ireland between Men and Women aged between 15 to 65 years old. A graph from this report is illustrated in Fig 1, this graph does not clearly indicate sugar consumption (Damian. Loscher, 2015).
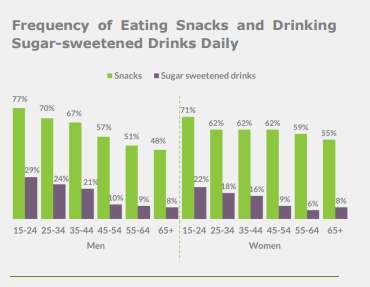
Figure 1-Health Ireland Survey 2015 -(Damian.Loscher,2015)
1.3 Aims
1. To obtain and examine knowledge on Data Science, in particular the area of Big Data and Data Analytics.
2. To investigate websites which have datasets and explore the various techniques to cleanse, extract and illustrate the data.
1.4 Objectives
2 To explore the various websites, evaluate and locate suitable datasets for this project and skills required for streaming data from large websites.
3. To examine various types of Tools and Technology that can be used in the process of Data Analytics.
4. To Investigate the different types of scripting languages that can be used in Data Analytics.
5. To examine and understand the working capabilities of Python and the packages that are available within Python.
1.5 Intellectual challenge
Overview: The author of this project, has no previous knowledge of Data Science, Big Data, and Data Analytics. The author hopes to obtain a working knowledge of the overall concept of Data Science and what are the elements that are contained within this area. The author also will examine and explore the terminology of Big Data and the relevant technology used in relation to Data Science. The author will investigate the process of Data Analytics and how the process involves obtaining data to illustrate the predicate result. The author will also develop the essential skills in using Python and produce scripts to extract the necessary requirements.
Why (this project):
The rise in employment in the Data Science sector and various companies requiring the skills of Analytics.
To confirm, Governments are concerned about the rise in sugar consumption and the adverse effect this is having on people’s lives. Previous research is mainly directed towards various types of food not particularly the intake of sugar.
1.6 Research Methods
Journals, academic papers, books, and various websites (kdnuggets etc.) will be the main source of existing research on Data Science. Data will be required on diabetes a sugar related disease to show the rise in this illness for people who range from the age of 20 to 79. Data will also be obtained by streaming and locating the relevant datasets. Python will be used to process the Data by means of extracting, cleansing, and clustering the Vital Data. Python and Plotly will be utilized to display the extract data in graphical form.
2. Scope
Extensive research will be out to obtain the relevant information to complete this project. This project will be completed by gaining an extensive working knowledge of the terminology of Data Science, Big Data, Data Analytics. Streaming and locating datasets, which will be imported into Enthought Canopy and python scripts will illustrated the results of the data in graphical form. For this project to succeed the location of the correct datasets is vital.
The datasets will be collected from the world datasets, U.K and Ireland government websites to examine the importing of raw sugar. Data will also be streamed from Twitter to examine how much people are talking about sugar. To Investigate sugar related diseases such as diabetes and the rise of the illness across the world.
2 .1 Big Data – To obtain an overall understanding of Data Science, mainly the area of Big Data and Data Analytics.
Investigate the main concepts of Data Science and in-depth the understanding of Big Data and Data Analytics. Research the technology and terms used within Data Analytics and Machine Learning and identifying the relationship between Big Data and Data Analytics.
2.2 Data -To explore the various websites, evaluate and locate suitable datasets for this project and skills acquired for streaming data from large websites.
Research various websites, journals, and white papers to find the location of suitable data sets. Read the various datasets to establish if the information is suitable regarding this project. Examine ways to streams data from Twitter. Investigate the file extension of the data sets to ensure that the datasets have not already been cleaned.
2.3 Technology – To examine various types of Tools and Technology that can be used in the process of Data Analytics.
Examine the various types of tools and technologies that could be used to clean, extract and display data from the datasets. For example, can the data be illustrated in excel. Consider all the tools and technologies, then evaluate which tools is to be used in this project.
2.4 Scripting Language – Investigate the different types of scripting languages that can be used in Data Analytics.
Research the different types of scripting languages which can be used in Data Analytics. Compare two programming languages to established which is going to be used in this project.
2.5 Python-To examine and understand the working capabilities of Python (Enthought Canopy).
Register for a course which has a guide tutorial on the Python (Enthought Canopy) these are available on Udemy at beginner’s level.
3.Plan
This outlines the time- frame given to each section of the project. The plan offers guidelines for the project but clearly indicates the deadlines that are required to complete the project.
3.1 First Term
| Task Name | Duration | Start | Finish | Weeks in total |
| Project Proposal | 21 days | Mon 19-09-16 | Fri 07-10-16 | 3 |
| Project Idea – research | 11 days | Mon 19-09-16 | Wed 12-10-16 | |
| Aims | 5 days | Mon 19-09-16 | Fri 23-09-16 | |
| Objectives | 5 days | Mon 19-09-16 | Fri 23-09-16 | |
| Project scope & plan | 14 days | Fri 07-10-16 | Fri 21-10-16 | 2 |
| Research scope | 4 days | Fri 07-10-16 | Wed 12-10-16 | |
| Outline plan | 10 days | Wed 12-10-16 | Fri 14-10-16 | |
| Literature Survey | 46 days | Mon 26-09-16 | Fri 11-11-16 | 7 |
| Research Data Analytics | 33 days | Mon 17-10-16 | Mon 07-11-16 | |
| Research python | 13 days | Tue 01-11-16 | Fri 11-11-16 | |
| Software Requirements | 21 days | Mon 31-10-16 | Mon 21-11-16 | 3 |
| Research software | 15 days | Mon 31-10-16 | Tue 15-11-16 | |
| Software Requirements | 6 days | Tue 15-11-16 | Mon 21-11-16 | |
| Design | 21 days | Mon 21-11-16 | Mon 05-12-16 | 3 |
| Design research | 14 days | Mon 21-11-16 | Mon 28-11-16 | |
| Design | 7 days | Mon 28-11-16 | Mon 05-12-16 | |
| Oral Presentation | 14 days | Mon 05-12-16 | Fri 16-12-16 | 2 |
| Presentation Research | 14 days | Mon 05-12-16 | Fri 16-12-16 |
Table 1- Table showing plan for first term
3.2 Second Term – Plan
| Task Name | Duration | Start | Finish | Weeks in total |
| Software Development | 39 days | Mon 23-01-17 | Fri 03-03-17 | 6 |
| Software Development – research | 24 days | Mon 23-01-17 | Wed 15-02-17 | |
| Learning Software | 7 days | Thu 16-02-17 | Thu 23-02-17 | |
| producing software | 6 days | Fri 24-02-17 | Fri 03-03-17 | |
| Interim Presentation | 11 days | Mon 06-03-17 | Fri 17-03-17 | 2 |
| Interim Presentation | 5 days | Mon 06-03-17 | Fri 10-03-17 | |
| Presentation | 6 days | Mon 13-03-17 | Fri 17-03-17 | |
| Draft final Report | 34 days | Mon 20-03-17 | Fri 21-04-17 | 5 |
| Draft report | 14 days | Mon 20-03-17 | Mon 03-04-17 | |
| Report | 17 days | Tue 04-04-17 | Fri 21-04-17 | |
| Final Report | 11 days | Mon 03-04-17 | Fri 14-04-17 | 2 |
| Create report | 11 days | Mon 03-04-17 | Fri 14-04-17 | |
| Oral Presentation | 11 days | Mon 17-04-17 | Fri 28-04-17 | 2 |
| Presentation preparation | 11 days | Mon 17-04-17 | Fri 28-04-17 |
Table 2- Table showing the plan for term 2
4 Literature Survey
4.1 Overview
Technology has become such a significant part of our daily lives with the rise in hand held devices which range from the phone to the tablet. All this technology means that information or data is available and people want to access this data as they need it. Imagine all the data or information, from all the sources around the world, floating about with no specific relevance. That data could be extremely relevant, for all various types of industries, if the data was extracted correctly and analysed, the data could be used as an essential marketing tool.
4.2 A brief history of Big Data
Questioning information or data, to obtain an answer has been going on for centuries. The ability to question data on a larger scale came around the 1960s, when computers started to appear on the market. The ability to compute data, opened doors for major companies, to obtain information or data on what customers want (Hurwitz et al., 2013).
In the 1970s the data model and the RDBMS created a structure for data accuracy, this meant that the data could be abstracted, cleaned, and queried to generate reports for various types of industry to research the extracted data. Over the last number of years, these methods have advanced, to what we know as Big Data. Data modelling has transported the way companies gather, extract, clean and use data as a major marketing tool to gain information on their customers’ requirements (Hurwitz et al., 2013).
4.3 Big Data
Around the late 1990s the term “Big Data”, was launched at the Silicon Graphics Inc although it did not become a massive buzz word until 2011 (Diebold, 2012).
Big Data can be defined as a term, used to described the huge datasets, which consist of both structured and non-structured data. These data sets can be very complex, however with techniques and various types of tools, this can enable the collecting, storage, cleansing, extract of the data to be analysed. The analysed data can offer great benefits to various types of industry (Sagiroglu and Sinanc, 2013).
There is a massive market for companies for all types of industries to know what people want. For example, the television company might what to know what types of programs people like to watch? This means the company could stream the data from a live feed such as Facebook or twitter. As the internet, has grown people are now communicating at a fast rate with large volumes of data being produced. Big Data consists of may attributes, which is known as three Vs – Volume, Variety, and Velocity (Russom, 2011).
These attributes can be described in detailed below in the table:
| Name | Description | |
| Volume | Volume in relation to Big Data means, the size of data which can range from terabytes to petabytes. A terabyte can store the same amount of data equal to the storage of 1500 CDS. The volume is the main attribute of Big Data because the size of the data sets can be massive (Gandomi and Haider, 2015). | |
| Variety | Variety is the structural context of the dataset. This means that the dataset can be constructed with various types of data, from structure to non-structured data. Structure data is a data, that is structured correctly and requires no cleansing methods. Non-structured data is data which may contain inconsistent, incorrect, or missing data within the datasets. Datasets can have both types of data. There are various types of software available to cleanse the data and this can amend any missing or inconsistent data within the datasets (Gandomi and Haider, 2015). | |
| Velocity | The speed or the frequency in which the data can be generated is the velocity. Collecting the Big Data is not necessarily done all the time in real-time, it can also be collected via streaming for example, streaming live feed in Twitter. Therefore, the data can be obtained as quickly as possible. (Gandomi and Haider, 2015). | |
Big Data
Big Data means that larger datasets(Volume) which consist of various types of data (Variety) can be collected at a fast pace (Velocity). There are also additional dimensions of Big Data which are Veracity, Variability and Value (Gandomi and Haider, 2015). In Fig 2, the illustration is of six simple steps to complete Big Data successfully (Gandomi and Haider, 2015).
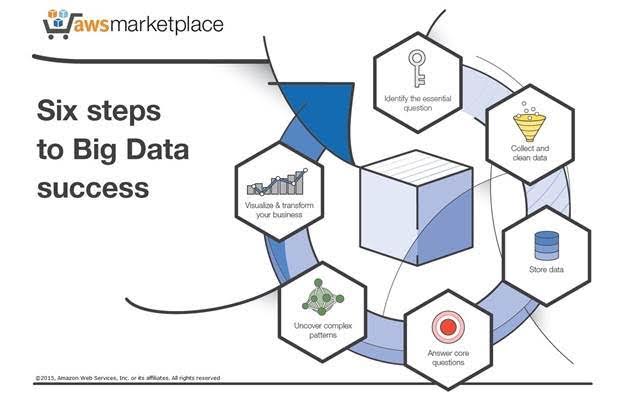
Figure 2- Simple steps to illustrate Big Data (Li,2015)
The term Big Data refers to the data, the type, size and rate however the data has no relevance until the data goes through a process called Data Analytics.
4.4 Data Analytics
Analytics is using tools and techniques, to analyse the data and extract any relevant data from the datasets and streaming data. Data Analytics is a term which is used to describe the techniques used to examine and transform the data from datasets and streaming data into relevant information which can be used to predict certain future trends.
The data can be used to produce reports from querying the data, it offers a prediction or interpretation of the data. For example, a dataset is located, on most popular cars bought over the last five years. When the dataset is checked for inconsistencies like missing data or incorrect data and then the data is cleaned. The cleaned data can be displayed in a bar chart or graph to visual the cars display bought over the last five years. Basically, Data Analytics turns the cleansed data into actionable data or information (Hilborn and Leo, 2013). There are various types of analytics, text analytics, audio analytics (LVCSR systems and phonetic-based systems), video analytics, social media analytics, social influence analysis and predictive analytics (Gandomi and Haider, 2015).
4.4 a Machine Learning:
Machine learning is the element of Data Science, that computes the algorithms effectively to construct the data models (Mitchell, 2002). Machine learning is an artificial intelligence that allows the computer to compute, by not having to be explicitly programmed. Machine learning allows the development of programs that can expanded and change when the new data is added. Machine learning has the intelligence to predict the patterns in the data and alter the program accordingly (Meng et al., 2016).
Machine learning algorithms are categorized into three different types which is supervised, non- supervised and semi-supervised.
Supervised can be described as the input and output variables which use algorithms to be mapped from the input to output accordingly. Supervised can be sub–divided into two sections: classification and regression. Unsupervised algorithms have an input variable with no corresponding output variables and can be also sub-divided into two categories: clustering and association. Semi-supervised is where data is considered to between the supervised and non-supervised (Brownlee, 2016). This project, will use the supervised machine learning algorithms along with unsupervised such as clustering.
4.5 Data terms used in Data Analytics
1. Data Mining
Knowledge discovery in databases (KDD) is another name given to data mining. Data mining is a more in-depth method of analyzing data from different dimensions (Ryan S J D Baker, 2010).
2. Data Cleansing
Data cleansing is a term given to the cleaning of data within datasets or huge amounts of data. When data is, collect or recorded, there is always an area of error or inconsistency with massive amounts of data. To cleanse the data, each data entry must be checked for missing or incorrect data entries. This can take a long time to achieve but there are software programs available to speed up the process of cleaning the data (Maletic and Marcus, 2000).
3. Clustering/Cluster analysis
This method involves gathering data of the same cluster/group together into one cluster. Basically, it is the grouping of a cluster of a similar task into a group. The groups or cluster are observed as a cluster and analysed as a cluster (Ketchen and Shook, 1996).
4.6 Relationship between Big Data and Data Analytics
All relationship has a bond, the data is the connecting bond between Big Data and Data Analytics. Although Data Analytics would not be possible without Big Data, as Big Data is the first stage in the process of Data Science. Big Data, or more importantly the data sets are not relevant until the data is processed or analysed. The analytics side of the relationship turns the data into useful or important data that can predicate future trends. With the correct techniques and tools this relationship can produce extremely productive information.
In Fig 3 is illustration of the process between Big Data and Data Analytics (Gandomi and Haider, 2015).
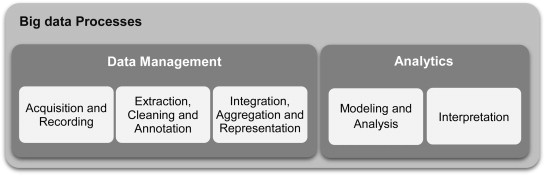
Figure 3- Process of Big Data (Gandomi and Haider,2015)
4.7 Datasets – Overview
Datasets are sets of data which consist of both structured and non-structured data. Several Government Departments, Public Administration or live feeds from Twitter can create these datasets (Ermilov et al., 2013).
4.7.1 Datasets – File Extensive
The data display in datasets is displayed in tabular form and is saved as CSV file or Excel extension. Although datasets saved in excel are normally cleansed data and are ready to display the result in visual format. CSV files can store extremely larger amount of data and the data must be cleansed before analysing. (Ermilov et al., 2013).
4.7.2 Datasets
Two methods will collect the data sets
1. Streaming data from a Twitter.
2.Collecting datasets from Global datasets, U.K and the Ireland.
4.8 Techniques use in Data Analytics/Data Science
Big Data and Data Analytics are elements of Data Science. To implement these elements, the assumption that an extensive knowledge of programming a language acted as a deterrent for people to understand the process. Data Science requires a considerable number of algorithms to produce the visual output of predictable information (Witten and Frank, 2005).
Thus, a lot of companies have invested a vast amount of time and money to produce software platforms where people can obtain knowledge of the Data Science by following simple steps. These software package have easy to follow GUI interface for the user to gain knowledge of Data Science with ease and confidence (Witten and Frank, 2005).
Below is a brief outline of some software packages that can help people to develop Big Data skills with little or no coding skills.
| Techniques | Overview | Open Source |