CHAPTER FOUR
3.5 EXPERIMENTAL DESIGN
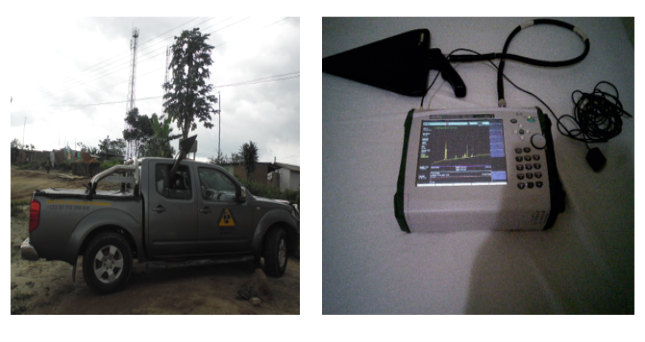
Figure 4.1: Setup during measurement
In this research work, the choice of instrument operation and parameters were established by quality assurance procedures. The following measurement parameters were investigated. These were: input attenuation, signal detection methods, resolution methods and measurement hold methods. The result of the quality assurance procedures are shown at the appendix. The study to measure and analyze power density levels was carried out with a total of 200 sites across the ten regions of Ghana as shown on table 4.1 below. The selection of the site for measurement was based on proportional sampling using mobile cell site population as well as the 2010 population census data. The measurement taken a location was always closer to a cell site than any other sources. The design of the measurement procedures was based on the Electronic Communication Committee (ECC) (ECC, 2007) protocol. A calibrated USA Anritsu Spectrum Master MS2720T with a serial number 1338067 and a frequency range of 9 KHz to 43 GHz was connected to a calibrated hand-held Transformational Security (TS) Log-periodic antenna TS-6021 with a serial number 00302 and a range of 750 MHz to 3 GHz by an Anritsu RF cable with a serial number 39317A. A magnetic Global Position System (GPS) connected to the Spectrum Master takes the location coordinate during measurement as shown in figure 4.1 above
Table 4.1: The distribution of 2010 population and sample sites (15 analogue terrestrial stations
|
Region of Ghana |
Population (2010 census) |
Number of FM (June, 2015) |
Number of cell site |
Number of measurement site |
Sampling Date |
|
Greater Accra Ashanti Eastern Central Western Volta Brong Ahafo Northern Upper East Upper West |
4,019,388 4,783,812 🌟 Want a distinction, not just a pass?Our writers don't just meet the brief — they study your marking rubric and target the exact criteria that separates a B from an A. Aim for Distinction Average order rating: 4.9 / 5.0 2,638,494 2,194,635 2,367247 2,120,659 2,317929 2,490541 1,035671 690,447 |
45 43 32 25 46 27 50 24 12 9 |
4041 2377 832 832 1189 594 832 Everything included in your order price ✓ Original paper written from scratch ✓ Free plagiarism similarity report ✓ Unlimited revisions within 30 days ✓ Direct messaging with your writer ✓ Correct citation style guaranteed ✓ On-time delivery or money back ✓ Full confidentiality — your data never shared ✓ 24/7 support from real people Place My Order Now No hidden fees · See total before paying 713 238 238 |
68 40 14 14 20 10 14 12 4 4 |
September,2014 July,2014 June,2015 July,2015 September,2015 August,2014 November,2014 October,2014 October, 2014 October, 2014 |
.
💬
Talk directly to your writer — no middleman.
Unlike other services, our platform lets you message your writer directly. Share extra instructions, ask questions, and get real-time updates as your paper is written.
No call centres — real writers
The sampling towns and location were pre-determined as plotted on the map in figure 4.2. These locations were mostly regional capitals and some surrounding towns and villages.
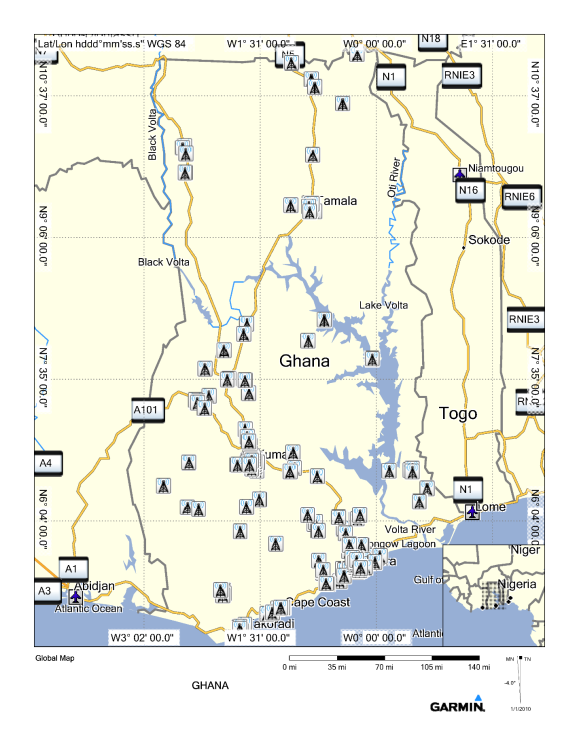
Figure 4.2: GPS location showing places where radiofrequency measurements were made indicated by the tower symbols on the map
The measurement at a spot involve taking measurement at three different heights: 1.0, 1.5 and 1.7 m above the ground. This is illustrated by the ECC raster below in the figure 4.3 below.
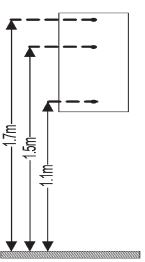
Figure 4.3: Revised ECC recommendation (02)04 proposed raster
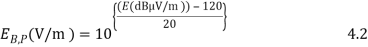
Measurements with the antenna was taken in two perpendicular plane at each height, with the axis of the antenna directed toward the reference cell site. A set of mutually perpendicular polarization measurements leads to the estimation of the maximum field arriving from a specific direction irrespective of its polarization. The measured field strength in dBµV/m from the spectrum data was corrected and converted to linear value using equation 4.1 and to V/m using equation 4.2. Figure 4.4 below shows a typical spectrum master measurement in the vertical plane that was taken at a town named Ahodwo in the Ashanti Region of Ghana.
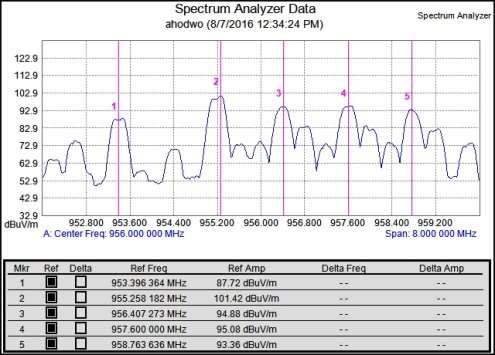
Figure 4.4: A typical spectrum master measurement taken at Ahodwo, a location in the Ashanti Region.

Where  is the corrected electric field strength for cable and antenna loses taking polarization into consideration.
  was the antenna loss correction factor which is the ratio of the incident electric field to the received electric field.
  is the measured electric field intensity without correction for cable and antenna and
  is the cable correction factor.
The spatial average when dealing with the electric field strength for each specific frequency lying within the frequency range of interest, the maximum expected spatial average (RMS)  across m selected spatial points was given by
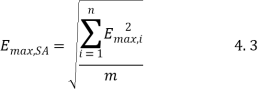
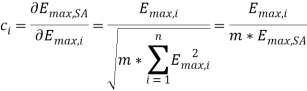
Where Emax, i is the maximum expected RMS field strength component at the spatial point i.The combined standard uncertainty u of the maximum expected field strength value calculated at the point i was estimated by taking into account the partial uncertainties of each
  components with a sensitivity coefficient
  is given by
Hence
U ( 4.4
4.4
To be able to assess the level of compliance with the standard set by the international commission for non-ionizing radiation protection(ICNIRP) and in a multiple frequency environment, the calculated spatial averaged electric field strength from the results of equation (4.3) for each operating frequency was processed into power density assuming a far field measurement and using the relation below:
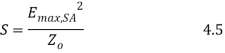
The uncertainty for each frequency was propagated to the power density estimated by

Where  was the assumed free space impedance (377Ω.). The compliance was calculated by summing the ration of the calculated power density value to that of the reference level as given below.
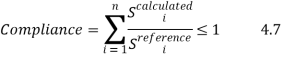
Where  represent the various sources being considered,
 is the calculated power density from equation (4.7) and
  is the corresponding ICNIRP public reference power density values.